← Back to Class 9 Artificial Intelligence
In artificial intelligence (AI), data plays a crucial role because AI systems learn from data to make predictions and solve problems. These notes introduce students to the concepts of data, types of data, data collection, data visualisation, data interpretation, and the importance of responsible data usage in AI applications. All the important information is taken from the Artificial Intelligence Class IX Textbook based on the CBSE Board Pattern.

Data Literacy Class 9 ai notes
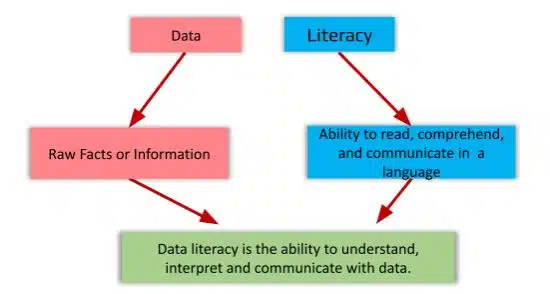
Every data set has a story; the ability to understand, explore, and communicate with data is known as data literacy. Data-literate people have the ability to derive meaningful information from data. Data literacy helps to analyse complex data or big data in summarised form.
Let’s see one example—
Identify the following table. How the data is arranged, you can see in the below table that the data is arranged properly, but there is no meaningful information. Here the data-literate person will analyze and give some meaningful information.
| Roll No | Student Name | Address | Job Title | Working Time |
|---|---|---|---|---|
| 1 | Rajesh Kumar | Mumbai | Supervisor | 9 AM – 5 PM (8 hrs) |
| 2 | Anil Kumar Sinha | Pune | Attender | 10 AM – 6 PM (8 hrs) |
| 3 | Ram Kumar Rawani | Delhi | Clerk | 8 AM – 4 PM (8 hrs) |
Here, the data literacy person will help to extract the data in a proper manner and give some meaningful information from it. Data Literate is a person who can interact with data to understand the world around them.
What is a data pyramid?
The data pyramid is a method to convert the raw data to the meaningful data; the data pyramid is also known as the DIKW pyramid, where “D” means data, “I” means information, “K” means knowledge, and “W” means wisdom. To convert raw data to meaningful information, we use the DIKW pyramid. The DIKW pyramid is a hierarchical model that represents the relationship between different levels of data.
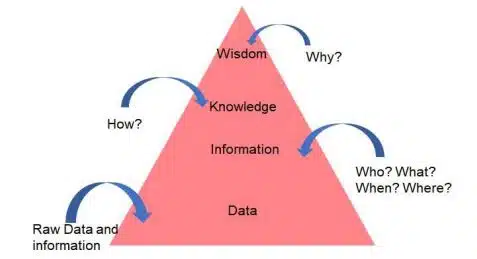
The flow of the DIKW pyramid starts from the bottom to the top.
- Data – The first stage is raw data; this stage of data is unprocessed data that is collected from the various sources. This data can have a number or text.
- Information – Data will become information when the data is processed and organised; raw data can become information using four relevant questions: “Who? What? When? Where?” These questions help to derive valuable knowledge from the data.
- Knowledge – Knowledge is an understanding that comes from information through interpretation and analysis. “How?” is a question that adds more meaning and value to the information, which helps to identify “How can we apply the information?”.
- Wisdom – Wisdom is the top level of the DIKW pyramid, which applies knowledge and experience to make the decisions. “Why?” is a question that is used to convert into action.
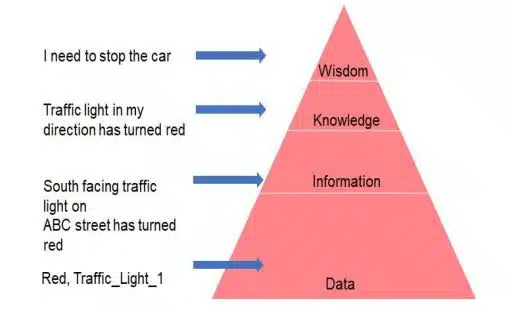
Let’s understand Data Pyramid with a simple Traffic Light example:
How to become Data Literate?
To become data literate, you have to understand, interpret, and effectively use the data in decision-making. To become data literate, develop the following things in yourself.
- Understand the Basics of Data
- Develop Statistical & Analytical Skills
- Learn to Work with Data Tools
- Interpret Data Accurately
- Develop Critical Thinking
Scenario: Buying a Video game online
Data literacy helps people research about products while shopping over the internet
- Which is the cheapest product available?
- Which product is liked by the users the most?
- Does a particular product meet all the requirements?
A data-literate person can –
- Filter the category as per the requirement – If the budget is low, select the price filter as low to high
- Check the user ratings of the products
- Check for specific requirements in the product
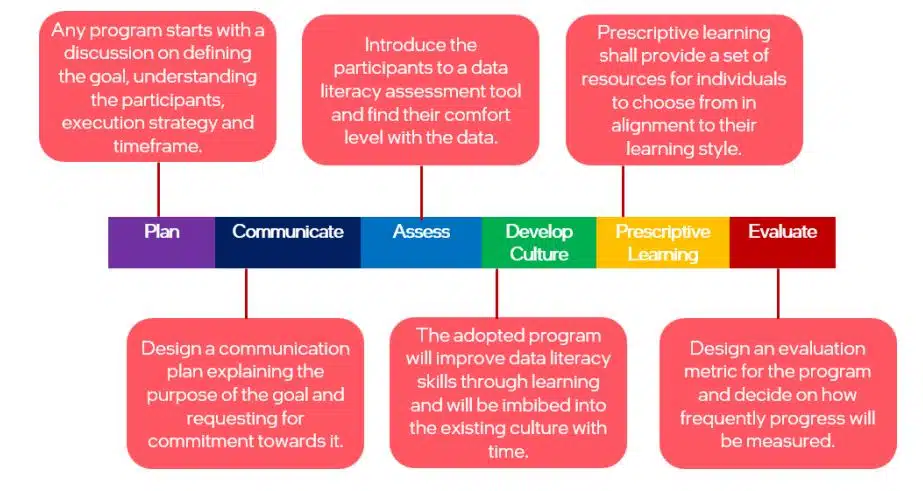
What is a Data Literacy Framework?
The data literacy framework provides a structured method to work efficiently with data. The data literacy framework includes Plan, Communicate, Assess, Develop Culture, Prescriptive Learning and Evaluate.
Data privacy and data security are the two important components of the data.
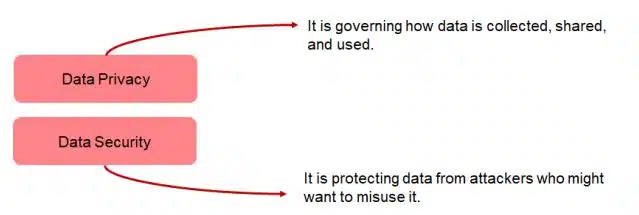
What is Data privacy?
‘Data privacy’ refers to the protection of the personal data and other confidential data. Data privacy ensures that the data is handled in a proper way on computers, which preserves the data protection rights of the individuals. The data privacy act in India is the Digital Personal Data Protection Act (DPDPA). This act ensures that all individual data can be used lawfully, fairly, and responsibly.

Why is it important?

The following best practices can help you ensure data privacy:
- Understanding what data you have collected, how it is handled, and where it is stored.
- Necessary data required for a project should only be collected.
- User consent during data collection must be of utmost importance.
What is data security?
Data security is the protection of data against unauthorised access. Data security also protects data from loss or corruption. Data security uses a wide range of security measures, for example, authentication, network security, encryption, or access controls.
Why is it important?
Due to the rising amount of data in the cloud, there is an increased risk of cyber threats. The most appropriate step for such an amount of traffic being generated is how we control and protect the transfer of sensitive or personal information at every known place.
The most possible reasons why data security is more important now are the following:
- Cyber-attacks affect all the people
- The fast-technological changes will boom cyber attacks
Best Practices for Cyber Security
Cybersecurity involves protecting computers, servers, mobile devices, electronic systems, networks, and data from harmful attacks.
Do’s
- Use strong, unique passwords with a mix of characters for each account.
- Activate Two-Factor Authentication (2FA) for added security.
- Download software from trusted sources and scan files before opening.
- Prioritise websites with “https://” for secure logins.
- Keep your browser, OS, and antivirus updated regularly.
- Adjust social media privacy settings for limited visibility to close contacts.
- Always lock your screen when away.
- Connect only with trusted individuals online.
- Use secure Wi-Fi networks.
- Report online bullying to a trusted adult immediately.
Don’t ‘s
- Avoid sharing personal info like real name or phone number.
- Don’t send pictures to strangers or post them on social media.
- Don’t open emails or attachments from unknown sources.
- Ignore suspicious requests for personal info like bank account details.
- Keep passwords and security questions private.
- Don’t copy copyrighted software without permission.
- Avoid cyberbullying or using offensive language online.
Acquiring Data, Processing, and Interpreting Data
What is data?
Data is a representation of facts or instructions about an entity that can be processed or conveyed by a human or a machine, such as numbers, text, pictures, audio clips, videos, and so on.
What are the different types of data?
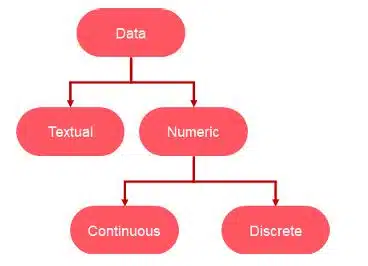
Data serving is a foundation of artificial intelligence; the data are classified into two types:
| Textual Data (Qualitative Data) | Numeric Data (Quantitative Data) |
|---|---|
| It is made up of words and phrases | It is made up of numbers |
| It is used for Natural Language Processing (NLP) | It is used for statistical data. |
| Search queries on the internet are an example of textual data | Any measurements, readings, or values would count as numeric data |
| Example: “Which is a good park nearby?” | Example: Cricket Score, Restaurant Bill |
Numeric data is further classified as the following:
- Continuous data is numeric data that is continuous. E.g., height, weight, temperature, voltage
- Discrete data is numeric data that contains only whole numbers and cannot be fractional E.g. the number of students in the class – it can only be a whole number, not in decimals
Types of data used in three domains of AI:

Data Acquisition/Acquiring Data
Data acquisition is a process where real-world data can be collected and converted into a digital form with the help of computers and software. For example, if you want to predict the salary of any employee based on the previous salaries, then you have to acquire the data from the different reliable sources, or you can feed the data directly to the machine.
The data acquisition involves searching for datasets suitable for training AI models. The process typically comprises three key steps:
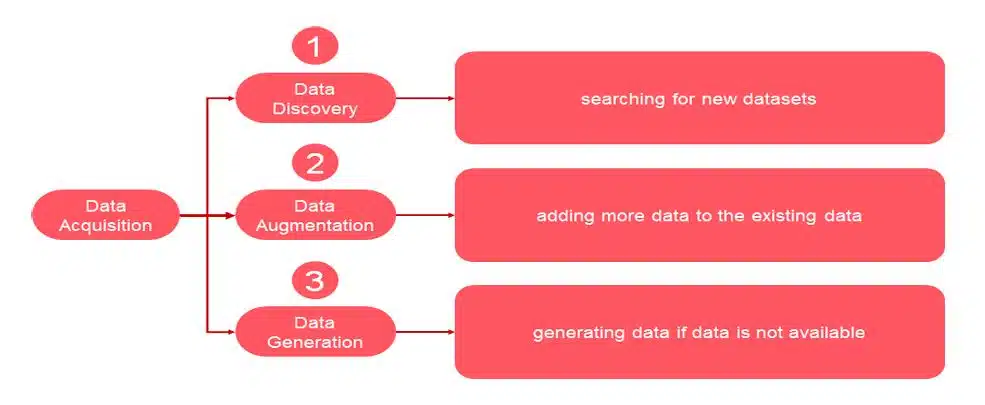
Acquiring Data – Sample Data Discovery
Let’s say we want to collect data for making a CV model for a self-driving car
- We will require pictures of roads and the objects on roads
- We can search and download this data from the internet
- This process is called ‘data discovery’.

Acquiring Data – Sample Data Augmentation
‘Data augmentation’ means increasing data by making small changes to existing data.
- Example: Taking one road image and changing its colour, brightness, or angle.
- The picture is still the same road, but now AI sees it in different ways.
- Helps AI learn better because it sees more variations.

Acquiring Data – Sample Data Generation
Creating new data using sensors or devices.
- Example: Recording temperature readings of a building with sensors.
- This data is then stored in a computer in a usable form.
- It’s like making fresh data yourself instead of searching online.

Sources of Data
There are two methods used to acquire data from the various sources.
Primary Data Source – If the data is collected from the original source, it is known as a primary data source. This data is original data and more reliable data. This data is used for research purposes. Some of the sources for primary data include surveys, interviews, experiments, etc. The data generated from the experiment is an example of primary data.
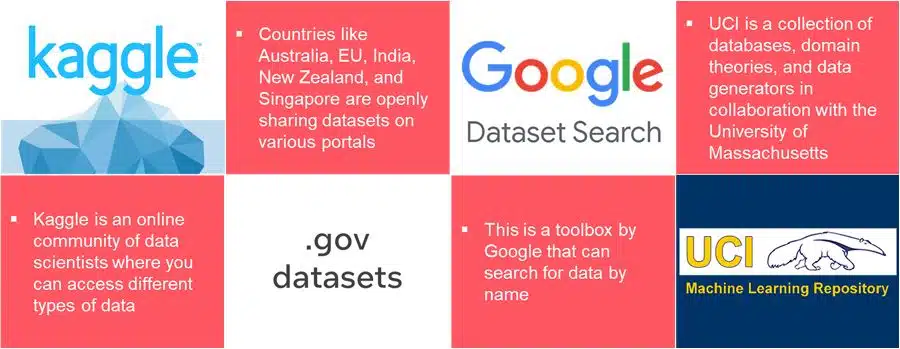
Secondary data source – This type of data is collected from someone else for other purposes or from external sources and is known as a secondary data source. It is not real-time data, as the research has already been done on this type of data. Some of the sources for secondary data sources include government websites, published journals, reviews, etc. Some sources for secondary data collection include:
Best Practices for Acquiring Data
To acquire the data from the different sources, you have to understand the difference between good data and bad data.
| Good Data | Bad Data |
|---|---|
| Information is well structured | Information is scattered |
| It is accurate | Contains a lot of incorrect values |
| It is consistent | Contains missing and duplicate values |
| It is cleanly presented | It is poorly presented |
| Contains information which is relevant to our requirement | Contains information which is not relevant to our requirement |
Data acquisition from websites

Ethical concerns in data acquisition
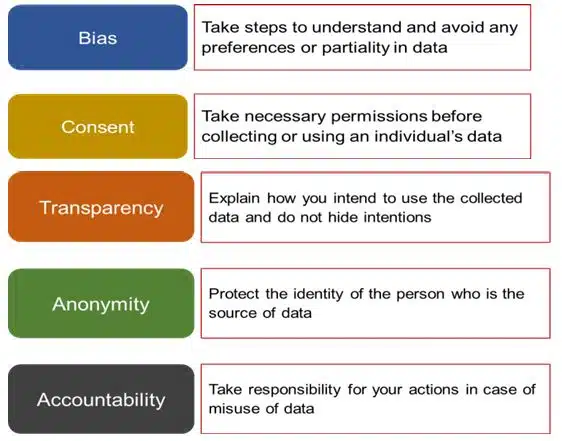
Ethical concerns in data acquisition mean knowing the difference between right and wrong, always trying to do the thing in the right manner and protecting the privacy of individuals. Some of the ethical concerns in data acquisition are:
Features of data and data preprocessing?
Data preprocessing refers to the process of making the data in an organized format using structuring, cleaning, and accuracy from the raw data to ensure that the quality and consistency will remain the same. There are three primary factors determining the usability of data.
Structure – Define how data is stored. Data should be stored in a structured method; if data is not structured, then it will be difficult for machines to understand the data.

Cleanliness – Clean data is always useful for data analysis; clean data is free from duplicate values, missing values, outliers, and other anomalies that may affect its reliability.

Accuracy – Accuracy helps to indicate how well the data matches with the real world, which helps the quality and trustworthiness of the dataset; accurate data closely reflects actual values without errors.

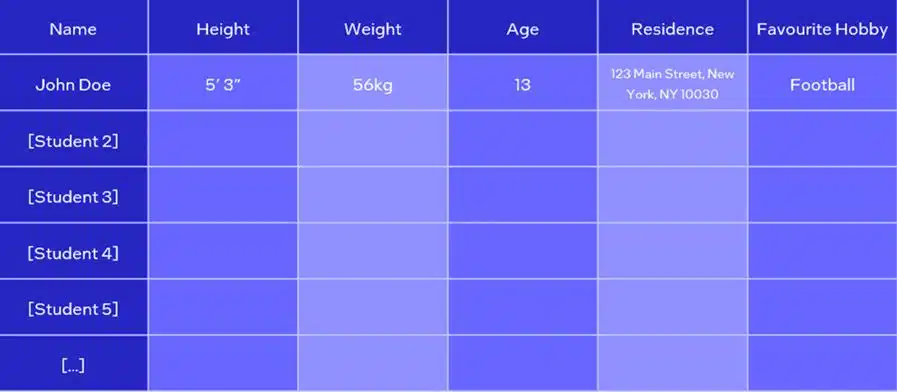
Features of data
Data features are the most important steps in machine learning; they describe each and every piece of information present in the data. They are just like characteristics or properties of the data. For example, in a table of student records, features could include things like the student’s name, age, or grade. In a photo dataset, features might be the colors present in each image. These features help us understand and analyze the data.
In AI models, we need two types of features: independent and dependent.
- Independent – Independent features help to predict the outcome based on input data given to the model.
- Dependent – Dependent features help to predict the outcome based on what we are trying to predict; dependent features can be manipulated.
Data Processing and Data Interpretation?
Data interpretation is the process of making sense out of data that has been processed, the interpretation of data helps us answer critical questions using data.
Data processing example,
Data processing helps computers understand raw data.
- Niki has 7 candies and Ruchi has 4 Candies.
- In data processing, Add them together 7 + 4 = 11
- They have 11 candies in total, this is data processing because we are calculating form given bumbers.
Data interpretation example,
It is the process of making sense out of data that has been processed.
- Who should get more candies so both have equal.
- Niki has 7 candies, and Ruchi has 4 candies.
- Data interpretation, difference = 7 – 4 = 3
- Ruchi needs 3 more candies to be equal to Niki, This is data interpretation because we are understanding the meaning of the data and making decision.

- Acquire Data – Acquiring data isto collect data from various data sources.
- Data Processing – After raw data is collected, data is processed to derive meaningful information from it.
- Data Analysis – Data analysis is to examine each component of the data in order to draw conclusions.
- Data Interpretation – It is the ability to explain what these findings/conclusions mean in a given context.
- Data Presentation – In this step, you select, organise, and group ideas and evidence in a logical way.
Methods of Data Interpretation
There is two ways to interpret data –
- Qualitative Data Interpretation
- Quantitative Data Interpretation
Qualitative Data Interpretation
Qualitative data tells us about the emotions and feelings of people. Qualitative data interpretation is focused on the insights and motivations of people.

Data Collection Methods – Qualitative Data Interpretation
- Record keeping: record-keeping method is the most important method for collecting qualitative data from the data source; it is just like going to a library.
- Observation: The observation method helps to identify the behaviour and emotions of the participant carefully.
- Case Studies: In this method, data is collected from case studies.
- Focus groups: In this method, data is collected from a group discussion on a relevant topic.
- Longitudinal Studies: This data collection method is performed on the same data source repeatedly over an extended period.
- One-to-One Interviews: In this method, data is collected using a one-to-one interview.
5 Steps to Qualitative Data Analysis
- Collect Data
- Organize
- Set a code to the Data Collected
- Analyze your data
- Reporting
Quantitative Data Interpretation
Quantitative data interpretation is a process for analysing numerical data using statistical methods. It helps us answer questions like “when”, “how many”, and “how often”. For example, how many numbers of likes are on the Instagram post?
Data Collection Methods – Quantitative Data Interpretation
- Interviews: Quantitative interviews play an important role in collecting information.
- Polls: A poll is a type of survey that asks simple questions of respondents. Polls are usually limited to one question.
- Observations: Quantitative data can be collected through observations in a particular time period.
- Longitudinal Studies: A type of study conducted over a long time
- Survey: Surveys can be conducted for a large number of people to collect quantitative data.
4 Steps to Quantitative Data Analysis
- Relate measurement scales with variables
- Connect descriptive statistics with data
- Decide a measurement scale
- Represent data in an appropriate format
Difference between Qualitative & Quantitative Data Interpretation
| Qualitative Data Interpretation | Quantitative Data Interpretation |
|---|---|
| Categorical | Numerical |
| Provides insights into feelings and emotions | Provides insights into quantity |
| Answers how and why | Answers when, how many or how often |
| Methods – Interviews, Focus Groups | Methods – Assessment, Tests, Polls, Surveys |
| Example question – Why do students like attending online classes? | Example question – How many students like attending online classes? |
Types of Data Interpretation
There are three ways in which data can be presented:
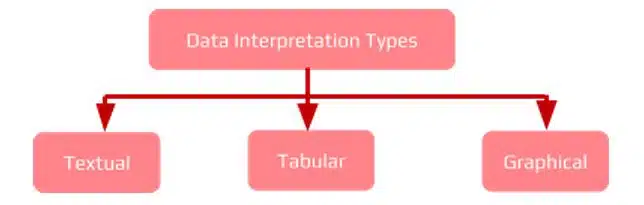
- Textual Data Interpretation – In this data interpretation, the data is mentioned in the form of text, usually in a paragraph. Textual data interpretation is used when the data is not large and easy to comprehend by reading. It is not suitable for large data.
- Tabular Data Interpretation – In this data interpretation, the data is represented in the form of rows and columns. where the title contains the description and information contained in columns.
- Graphical Data Interpretation – In this data interpretation, the data is represented in the form of graphs like bar graphs, pie charts, line graphs, etc.
Graphical Data Interpretation
Graphical Data Interpretation is the graphical representation of the data. Graphical Data Interpretation uses visual elements like charts, graphs, and maps for understanding the data.
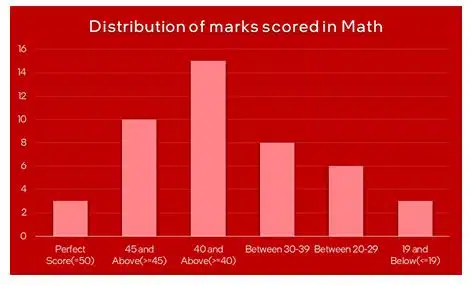
Bar Chart – Bar charts are used to compare the data and help to show the distribution of the data. In a bar graph, data is represented using vertical and horizontal bars.
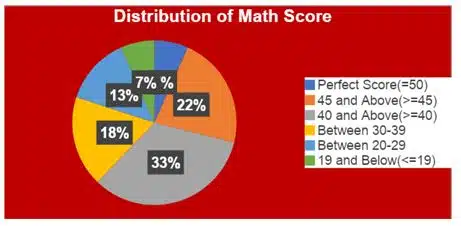
Pie Chart – Pie charts have the shape of a pie, and each slice of the pie represents the portion of the entire pie allocated to each category. It is a circular chart divided into various sections (think of a cake cut into slices). Each section of the pie chart is proportional to the corresponding value.
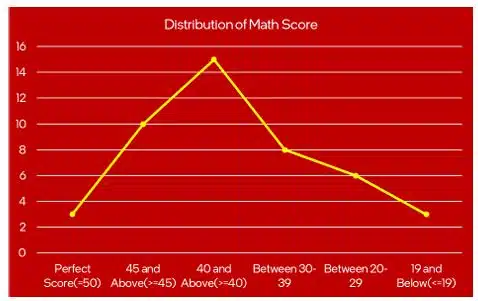
Line Graphs – A line graph is created by connecting various data points; it shows the change in quantity over time.
Importance of Data Interpretation
Data interpretation is important because it helps to transform raw numbers into meaningful insights, it helps the people to make decisions, and it helps to recognise trends and solve the problems efficiently.
- Supports Decision-Making: Businesses, researchers, and governments rely on data interpretation to make decisions instead of guesses. Example: A company interprets sales data to decide which product to promote.
- Turning Data into Insight: Data interpretation helps to transform the raw data into meaningful data, which helps to understand patterns, relationships, and trends hidden in the data.
- Problem-Solving Skills: Helps to build logical thinking by analysing charts, graphs, and tables.
- Recognizing Trends: Helps predict future outcomes by spotting patterns over time. Example: Interpreting rainfall data to forecast droughts or floods.
- Efficiency: Saves time and money by quickly identifying the best solutions. Example: Interpreting customer feedback to improve services.
Disclaimer: We have taken an effort to provide you with an accurate handout of “Data Literacy Class 9 AI notes“. If you feel that there is any error or mistake, please contact me at anuraganand2017@gmail.com. The above CBSE study material present on our websites is for education purpose, not our copyrights. All the above content and Screenshot are taken from Artificial Intelligence Class 9 CBSE Textbook and Support Material which is present in CBSEACADEMIC website, This Textbook and Support Material are legally copyright by Central Board of Secondary Education. We are only providing a medium and helping the students to improve the performances in the examination.
For more information, refer to the official CBSE textbooks available at cbseacademic.nic.in
I love this. Tysm.
Very good
nice