
← Back to Class 9 Social Science Notes
Understanding why the prices of goods and services change is an important part of economics. The Price Puzzle: What Drives the Market Class 9 Notes explains how demand and supply work together to determine market prices. This chapter introduces students to key concepts such as the Law of Demand, Law of Supply, market equilibrium, price determination, factors affecting demand and supply, and the role of the government in markets.
The Price Puzzle What Drives the Market Class 9 Notes
Have you noticed that some product prices change over time? For example, mangoes become cheaper when there is a large harvest. Flight ticket prices change depending on demand. Shops offer discounts during the festivals. These changes happen due to demand and supply.
For example, at the beginning of the mango season, mangoes are expensive, and people buy few mangoes, but when more mangoes arrive in the market, then the price falls, and people buy more mangoes.
What is demand?
Demand is the quantity of a product that people are willing and able to buy at a particular price. Demand is not just buying a product. Demand means the person must also have the money to buy the product.
What is the law of demand?
When the price rises, then the quantity demanded decreases. When the price falls, then the quantity demanded increases. This is called the Law of Demand. It shows an inverse relationship between price and demand.

What is individual demand?
Individual demand is the quantity of a product that one consumer wants to buy at different prices, keeping other factors the same. For example, If Amit want to buy a mango, when the price is –
| Price | Quantity Demanded |
|---|---|
| ₹150 | 1 kg |
| ₹100 | 2 kg |
| ₹50 | 3 kg |
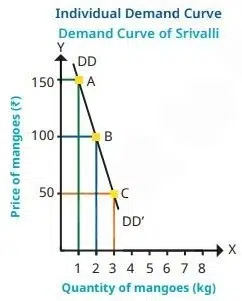
When the price decreases, then Amit wants to buy more mangoes.
What is a demand schedule?
A demand schedule is a table showing different prices and the quantity demanded. For example, Amit’s demand schedule—
| Price | Quantity Demanded |
|---|---|
| ₹150 | 1 kg |
| ₹100 | 2 kg |
| ₹50 | 3 kg |
What is a demand curve?
A demand curve is a graph that shows the relationship between price and quantity demanded. X-axis is quantity demanded and Y-axis is a price.
Points on the Graph
- Point A: ₹150 → 1 kg
- Point B: ₹100 → 2 kg
- Point C: ₹50 → 3 kg
Joining these points forms the demand curve (DD’).
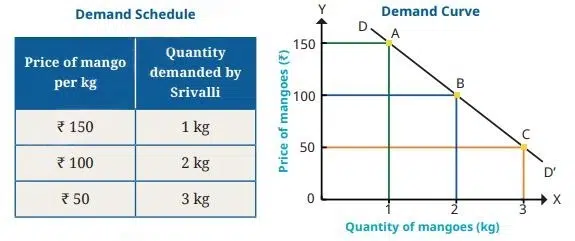
Here in the graph, the demand curve slopes downward from left to right. This downward slope shows the inverse relationship between price and demand.
What is market demand?
Market demand is the total quantity demanded by all consumers in the market at different prices. It is the sum of all the individual demands. The formula of market demand is
Market Demand = Demand of Consumer 1 + Demand of Consumer 2 + Demand of Consumer 3
For example,
There are three consumers—
- Srivalli
- Alex
- Israt
| Price | Srivalli | Alex | Israt | Market Demand |
|---|---|---|---|---|
| ₹150 | 1 kg | 2 kg | 3 kg | 6 kg |
| ₹100 | 2 kg | 4 kg | 6 kg | 12 kg |
| ₹50 | 3 kg | 6 kg | 9 kg | 18 kg |
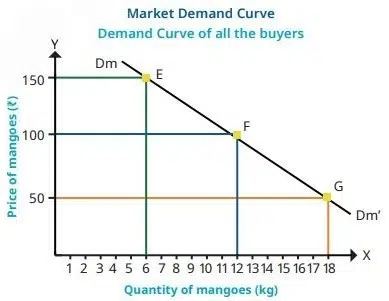
The market demand curve can be drawn by plotting the total demand of all consumers at different prices. When the slope is downward from left to right, it shows that the prices fall and total market demand increases.
Other Determinants of Demand
Demand does not change only because of price; sometimes other factors influence how much people want to buy, even if the price stays the same.
The demand for a good can be affected by changes in the prices of related goods. There are two types of related goods:
- Substitute goods: There are some goods that can replace each other. For example, tea and coffee. If coffee becomes expensive, then people can switch to tea.
- Complementary goods: There are some goods used together. For example, smartphones and earphones, cars and gasoline. If the demand for printers increases, then the demand for cartridges also increases.
2. Income of the consumer
When the household income rises, the people can afford more goods or better quality. For example, a family with a higher income may buy branded clothes instead of local clothes.
3. Test and preference
Demand depends on likes, dislikes, habits, and culture. For example, Amit loves mangoes, but he won’t switch to oranges even if the mango price is high.
4. Population size and composition
The larger the population, the higher the demand will be. Here “composition” matters, meaning more children demand toys, sports shoes, etc. More working adults can demand formal wear, or more elderly people can demand comfort/orthopedic products.
5. Seasonality
Demand can change with weather, festivals, and cultural habits. For example, sweaters in winter, sweets during Diwali, and books at the start of the school year.
6. Future price expectations
If the people expect prices to fall, then they can delay the purchases. If they expect the price to rise, then they buy immediately. For example, buyers wait for Diwali discounts before purchasing electronics.
What is supply?
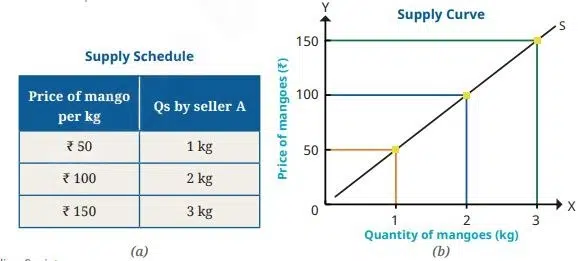
Supply is the quantity of a product that sellers are willing and able to offer at a particular price. It depends on the seller’s ability, cost of production, and profitability.
What is the law of supply?
When the price rises, then the quantity supplied increases. When the price falls, then the quantity supplied decreases because a higher price means more profit, so producers supply more. This creates the upward-sloping supply curve.
For example,
Market Supply
When multiple sellers are in the market, their supplies add up:
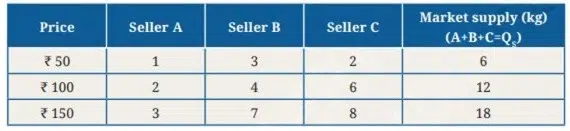
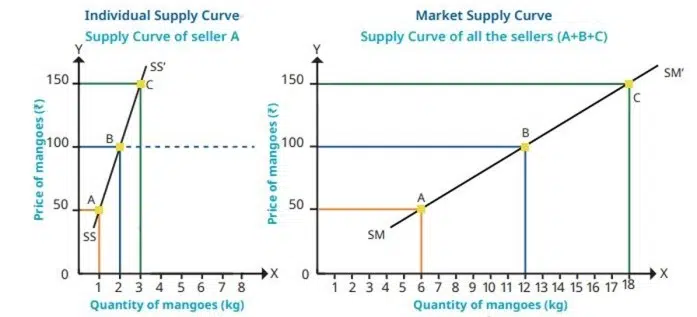
Adding all sellers’ supplies gives market supply. When plotted, the supply curve slopes upward, showing a direct relation between price and supply.
Other Determinants of Supply
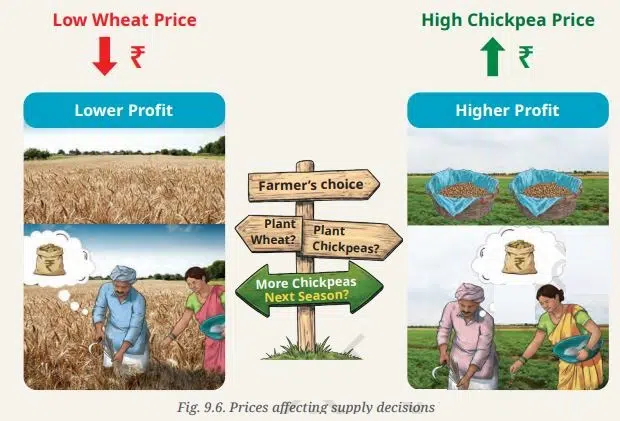
Producers choose what to produce based on profitability. For example, if the wheat price is low and chickpea price are high, then the former will grow more chickpeas. So, the supply of one good depends on the price of alternatives.
2. Number of sellers
If the seller is more than the market supply, it will be higher and prices will fall. If there are fewer sellers, then there is lower supply, and the price will increase. Competition directly affects supply levels.
3. Technology
Better technology reduces production cost, which increases supply. For example, in drip irrigation, weather sensors and cold storage for mangoes give higher output and wide market reach.
4. Future expectations
If producers expect demand or prices to rise, then they produce or hold back more now. If they expect demand to fall, then they reduce production. For example, potato wholesalers may store stock if they expect higher prices in peak season.
Market Equilibrium
The market equilibrium is the situation where the quantity demanded by buyers is equal to the quantity supplied by sellers. In this point –
- Buyers can buy the quantity they want.
- Sellers can sell all the goods they bring to the market.
- There is no shortage and no surplus.
- The market price remains stable.
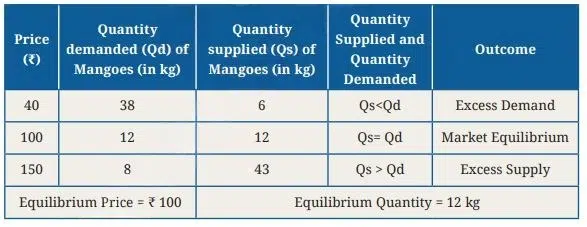
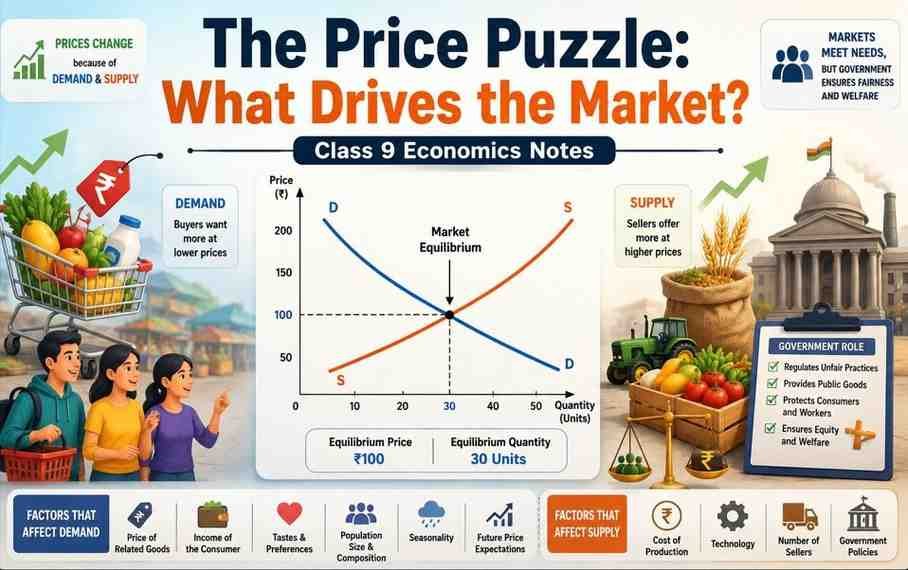
At a price of ₹100, the quantity demanded equals the quantity supplied. This point is known as the market equilibrium. At this point, there is no pressure for prices to change, and the market is ‘cleared’, which means that there is neither a shortage (excess demand) nor a surplus (excess supply).
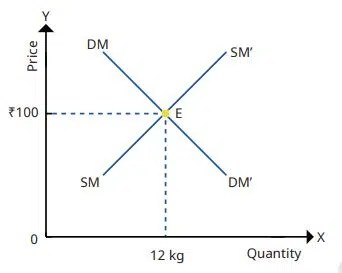
On the graph, equilibrium is where the demand curve DMDM’ intersects the supply curve SMSM’, that is, at point E, where the equilibrium price = ₹100 and the equilibrium quantity = 12 kg.
Does Market Equilibrium Exist in the Real World?
Yes, but only for the short period of time. In theory, market equilibrium is the point where demand equals supply, but in the real world, markets are always changing because demand and supply keep changing.
So, the market equilibrium is not permanent. The market is constantly adjusting to a new equilibrium.
Why Does Equilibrium Keep Changing?
Many factors affect demand and supply, causing the equilibrium price and quantity to change. The factors that can change demand and supply are
- Changes in technology
- Changes in wages
- Changes in interest rates
- Wars
- Political events
- Pandemics (such as COVID-19)
- Weather changes
- Natural disasters
Whenever these factors change, the demand curve or supply curve shifts, creating a new market equilibrium. During COVID-19, mask prices first increased due to high demand, then decreased as supply increased.
Role of Government in the Economy
India is the fourth-largest economy in the world. Prices depend on demand and supply, but the market does not always work fairly. The government steps in to ensure fairness, equity, and welfare.
1. Regulation of unfair practices
The government protects consumers, workers, and producers from exploitation and unfair business practices.
(a) Price Ceiling: A price ceiling is the maximum price the government allows sellers to charge for essential goods. This helps to prevent overcharging and make essential goods affordable. For example, the maximum price of essential medicines.
(b) Price Floor: The price floor is the minimum price fixed by the government. It ensures workers receive fair wages and protects workers from exploitation. For example, minimum wage for workers.
(c) Controlling Monopolies: A monopoly exists when one or a few sellers control the market, like higher prices, poor quality of goods, limited supply, etc. The government regulates monopolies to protect consumers.
Important Government Regulators
| Regulator | Full Form | Role |
|---|---|---|
| RBI | Reserve Bank of India | Regulates banks and the banking system |
| CCPA | Central Consumer Protection Authority | Protects consumer rights and prevents unfair trade practices |
| TRAI | Telecom Regulatory Authority of India | Regulates telecom services |
| SEBI | Securities and Exchange Board of India | Regulates the stock and securities market |
2. Provision of Public Goods
The public goods are goods and services provided by the government for the benefit of everyone, like roads, bridges, drainage systems, streetlights, etc.
Why doesn’t the private sector provide public goods?
The private company does not provide these goods because they are expensive; the company will not generate enough direct profit, and everyone can use them even without paying directly.
What is the free rider problem?
When people enjoy the benefits of a public good without contributing to its cost.
Limitations of Government Intervention
While government regulations are important to ensure fairness, too much intervention can create problems:
a) Price distortions and reduced producer incentives
A price distortion occurs when the government fixes prices that are different from the market price. For example, the market price of wheat is 30 rs per kg, but the government fixes the maximum price at 20 per kg.
As a result the farmer earns less money. The farmer will lose motivation to grow more wheat; because of this, the wheat shortage may occur.
b) Compliance burdens
Too many licenses, permits, and rules increase costs and time. For example, a small restaurant needs multiple clearances (food safety, fire safety, and pollution control). This discourages small businesses.
c) Discourages innovation and entrepreneurship
Heavy regulation and price controls reduce motivation to invest in better technology. For example, farmers won’t invest in improved seeds or irrigation if returns are too low; long‑term productivity decreases.
Disclaimer: The content that is present on our website is based on the NCERT Class 9 Social Science textbook and is provided for educational purposes only. All the content and images have been taken from Social Science Class 9 NCERT Textbook and CBSE Support material. Images and content shown above are the property of individual organizations and are used here for reference purposes only. To make it easy to understand, some of the content and images are generated by AI and cross-checked by the teachers.
Commendable notes
Thanks
best notes
BESTT for short notes really I have studied first time from this so lets see how much do I get from 80
This is a very resourceful website. The content not only helps me but also many needy students who have an inclination towards studies. I wish you will keep posting free of cost content and keep up the great work going.
True I am using this website to prepare for my exams
loved this website i recommend @cbseskilleducation.com to make more of this notes which helps in revision and many more things in life. This helped me solve my problems, save time and prevent me from getting scolded by my mother. So it is my sincere request to the concerned authorities to look into the matters of my problems as it can not only solve my problems by studying faster and more but also solve your problems in earning money, creating a very good reputed online website which can be accessed by anyone possessing a laptop or any other online device or gadget at any time ,and making much more in life….
Thank you so much for your wonderful feedback and recommendation! 😊
We’re truly happy to hear that our notes have helped you revise faster, save time, and make studying easier. Comments like yours motivate us to keep creating high-quality notes, MCQs, solutions, and study resources for students.
We sincerely appreciate your support and recommendation of **CBSE Skill Education**. We’ll continue working hard to add more useful content and improve the website so it can help even more students.
Thank you for being a part of our learning community. Wishing you the very best in your studies and future! 🌟