
Dynamics of Population Class 8 MCQ provides important multiple-choice questions based on the chapter Dynamics of Population. These MCQs cover key concepts such as population distribution, population density, population change, migration, birth rate, death rate, and factors affecting population. Students can use these questions to revise the chapter and prepare for school exams.
Dynamics of Population Class 8 MCQ
Conceptual Recall MCQ
Q. The study of population size, structure, and changes over time is called:
a) Geography
b) Sociology
c) Demography
d) Anthropology
Answer: c) Demography
Q. In 2023, which country became the world’s most populous nation?
a) China
b) India
c) Nigeria
d) United States
Answer: b) India
Q. The fertility rate of 2.1 is called:
a) Growth rate
b) Mortality rate
c) Replacement level fertility rate
d) Migration rate
Answer: c) Replacement level fertility rate
Q. Which Indian state has the largest share of population?
a) Maharashtra
b) Bihar
c) Uttar Pradesh
d) West Bengal
Answer: c) Uttar Pradesh
Q. The phenomenon of a large young population (16–30 years) is called:
a) Ageing population
b) Youth bulge
c) Demographic transition
d) Fertility decline
Answer: b) Youth bulge
Application‑Based MCQ
Q. A town has a very high proportion of elderly people. Which facility should the government focus on most?
a) More schools
b) More hospitals and healthcare centres
c) More playgrounds
d) More factories
Answer: b) More hospitals and healthcare centres
Q. A government notices that birth rates are falling in its country. Which of the following is the MOST likely outcome in future?
a) Rapid population growth
b) Population decline after some time
c) Increase in child mortality
d) More migration into the country
Answer: b) Population decline after some time
Q. A country has a fertility rate of 1.5. What is MOST likely to happen in the future?
a) Population will grow rapidly
b) Population will shrink gradually
c) Birth rate will increase sharply
d) Migration will stop completely
Answer: b) Population will shrink gradually
Q. A city like Bengaluru experiences rapid population growth due to migration. What is the MOST likely challenge faced?
a) More green spaces created
b) Pressure on housing and transport
c) Decline in literacy rate
d) Increase in agricultural land
Answer: b) Pressure on housing and transport
Q. A state has a sex ratio above 1,000 females per 1,000 males. What does this indicate?
a) More males than females
b) Balanced
c) Decline in literacy rate
d) Rapid urbanisation
Answer: b) Balanced
Q. India has nearly 65% of its population in the working‑age group. Which of the following is the MOST direct benefit of this?
a) More elderly care centres
b) Higher economic productivity and tax revenue
c) Decline in literacy rate
d) Increase in child mortality
Answer: b) Higher economic productivity and tax revenue
Assertion–Reason MCQ
Q. Assertion (A): Census in India is conducted every 10 years.
Reason (R): It helps to collect information about age, gender, education, and occupation of people.
a) Both A and R are true, and R is the correct explanation of A.
b) Both A and R are true, but R is not the correct explanation of A.
c) A is true, but R is false.
d) A is false, but R is true.
Answer: a) Both A and R are true, and R is the correct explanation of A.
Q. Assertion (A): Improved healthcare has helped people live longer.
Reason (R): Medical advancements like vaccines and antibiotics reduced deaths from diseases.
a) Both A and R are true, and R is the correct explanation of A.
b) Both A and R are true, but R is not the correct explanation of A.
c) A is true, but R is false.
d) A is false, but R is true.
Answer: a) Both A and R are true, and R is the correct explanation of A.
Q. Assertion (A): Birth rate and fertility rate are closely linked.
Reason (R): When fertility rate falls, fewer children are born, so birth rate also drops.
a) Both A and R are true, and R is the correct explanation of A.
b) Both A and R are true, but R is not the correct explanation of A.
c) A is true, but R is false.
d) A is false, but R is true.
Answer: a) Both A and R are true, and R is the correct explanation of A.
Q. Assertion (A): Lower mortality rate indicates better healthcare and nutrition.
Reason (R): Child mortality in India fell from 271 per 1,000 (1950) to 28 (2023).
a) Both A and R are true, and R is the correct explanation of A.
b) Both A and R are true, but R is not the correct explanation of A.
c) A is true, but R is false.
d) A is false, but R is true.
Answer: a) Both A and R are true, and R is the correct explanation of A.
Q. Assertion (A): Sex ratio is an important demographic indicator.
Reason (R): It shows the number of females per 1,000 males and reflects social and cultural dynamics.
a) Both A and R are true, and R is the correct explanation of A.
b) Both A and R are true, but R is not the correct explanation of A.
c) A is true, but R is false.
d) A is false, but R is true.
Answer: a) Both A and R are true, and R is the correct explanation of A.
Q. Assertion (A): India’s demographic dividend is a limited window of opportunity.
Reason (R): After 2050, the share of young population will decline, and ageing population will rise.
a) Both A and R are true, and R is the correct explanation of A.
b) Both A and R are true, but R is not the correct explanation of A.
c) A is true, but R is false.
d) A is false, but R is true.
Answer: a) Both A and R are true, and R is the correct explanation of A.
Case Study MCQ
Q. A district has 40% children, 50% working‑age adults, and 10% elderly. The government plans to build new infrastructure.
Which of the following is MOST important for this district?
a) More schools for children
b) More pension schemes for elderly
c) More hospitals for elderly
d) More shopping malls for adults
Answer: a) More schools for children
Q. A city has seen farmland converted into housing colonies, crowded streets with more cars, and smaller apartments replacing big houses.
Which of the following is the BEST reason for these changes?
a) Decline in population
b) Rapid urban population growth
c) Increase in literacy rate
d) Rise in agricultural production
Answer: b) Rapid urban population growth
Q. China introduced the One‑Child Policy in 1979 to control its fast‑growing population. As a result, fertility rate fell sharply, population started shrinking, and the share of elderly increased.
Which of the following was a MAJOR impact of this policy?
a) More young workers available
b) Stronger kinship networks with siblings
c) Rising elderly population and fewer workers
d) Rapid increase in fertility rate
Answer: c) Rising elderly population and fewer workers
Q. Many young people migrate from villages to cities for jobs and education. Villages then face shortage of youth, while cities become overcrowded.
Which of the following is the MOST likely impact on villages?
a) More employment opportunities created in villages
b) Decline in working‑age population in villages
c) Increase in literacy rate in villages
d) Better transport facilities in villages
Answer: b) Decline in working‑age population in villages
Q. In the 1950s, India’s population pyramid had a wide base and narrow top. By 2020, the base became narrower, the middle wider, and the top broader.
Which of the following BEST explains this change?
a) Families having more children, low life expectancy
b) Families having fewer children, longer life expectancy, more working‑age adults
c) Decline in working‑age population, rise in child mortality
d) Rapid migration from villages to cities only
Answer: b) Families having fewer children, longer life expectancy, more working‑age adults
Q. Kerala and Tamil Nadu are already experiencing ageing populations, while Bihar and Uttar Pradesh still have younger populations.
Which of the following is the MOST likely challenge for Kerala and Tamil Nadu?
a) Need for more schools
b) Pressure on healthcare and pensions
c) Shortage of agricultural land
d) Decline in literacy rate
Answer: b) Pressure on healthcare and pensions
Diagram/Visual‑Based MCQ
Q. In a population pyramid, the broad base represents:
a) Large number of elderly people
b) Large number of children
c) Large number of working‑age adults
d) Equal number of all age groups
Answer: b) Large number of children
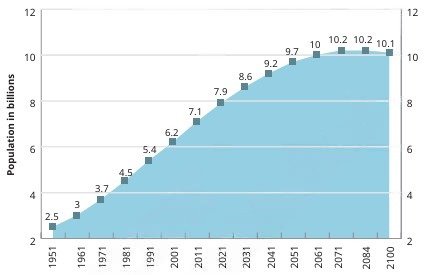
Q. In Figure (World Population Trends), the curve shows a sharp rise after 1950. What was the MAIN reason?
a) More wars after 1950
b) Better healthcare and sanitation
c) Decline in economic prosperity
d) Increase in migration
Answer: b) Better healthcare and sanitation
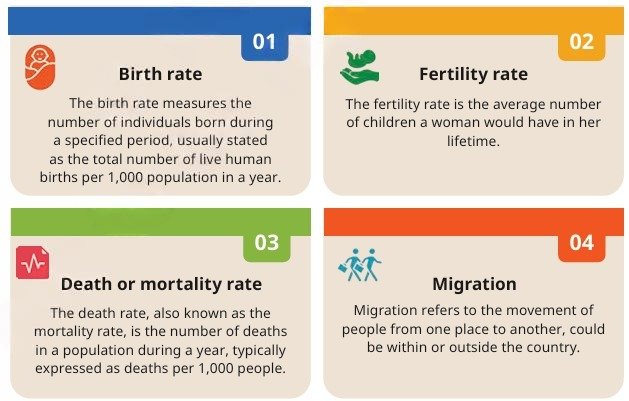
Q. In Figure (Key Indicators of Demography), which indicator shows the number of deaths per 1,000 people in a year?
a) Birth rate
b) Fertility rate
c) Mortality rate
d) Migration
Answer: c) Mortality rate
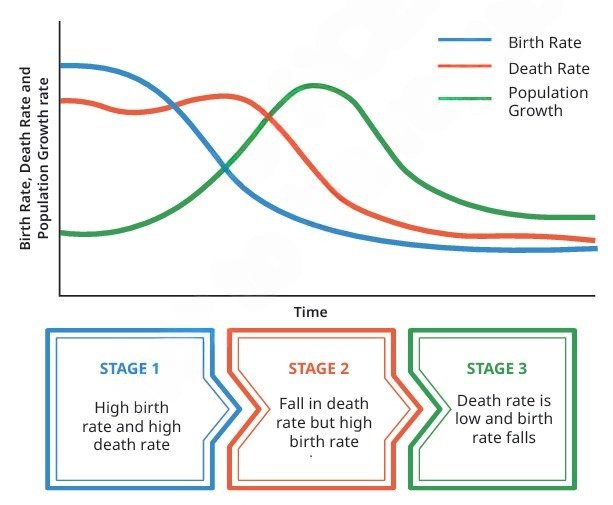
Q. In Figure (Demographic Transition), Stage 2 is characterised by:
a) High birth rate and high death rate
b) Low birth rate and low death rate
c) Falling death rate but high birth rate
d) Falling birth rate and rising death rate
Answer: c) Falling death rate but high birth rate
Q. In a population pyramid, if the middle part is widest, it indicates:
a) A young and growing population
b) A stable population with many working adults
c) An ageing population with more elderly
d) Equal number of all age groups
Answer: b) A stable population with many working adults
Q. In Figure (India’s population by age groups), the blue line after 2050 shows:
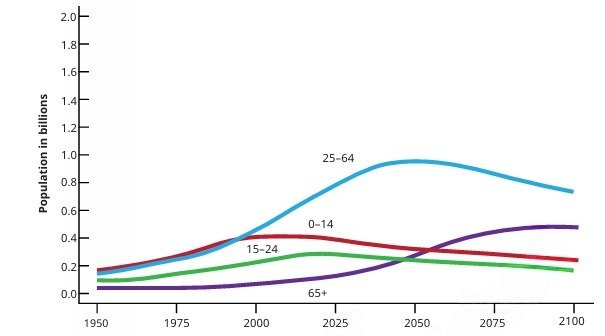
a) Rise in child population
b) Decline in young population
c) Increase in migration
d) Rise in fertility rate
Answer: b) Decline in young population
Disclaimer: The content that is present on our website is based on the NCERT Class 8 Social Science textbook and is provided for educational purposes only. All the content and images have been taken from Socail Science Class 8 NCERT Textbook. Images and content shown above are the property of individual organizations and are used here for reference purposes only. To make it easy to understand, some of the content and images are generated by AI and cross-checked by the teachers.