
In algebra, expressions play a key role in representing real-life situations using variables and numbers. In Class 9 mathematics, linear polynomials form the foundation for topics like linear equations, graphs, and algebraic simplification. Understanding them clearly helps students build strong problem-solving skills in algebra.
Introduction to Linear Polynomials Class 9 Notes
In this blog, we will learn about the special types of algebraic expressions called linear polynomials. An algebraic expression is a combination of numbers, variables (letters like x, y, z) and mathematical operations such as addition, subtraction, multiplication, etc. For example,
4x + 5y + 3
Here:
- x and y are variables.
- 4 and 5 are coefficients.
- 3 is a constant term.
- 4x, 5y, and 3 are called terms.
Example 1
Raju went to the shop to buy a pen and pencil. In the shop, each red box contains 4 pens, and each blue box contains 5 pencils. Suppose Raju wants to buy x red boxes and y blue boxes.

To find the number of pens and pencils
- Each red box has 4 pens, so x red boxes will have 4x pens.
- Each blue box has 5 pencils, so y blue boxes will have 5y pencils.
- Raju also gets 3 extra pens free.
The final algebraic expression will be –
4x + 5y + 3
The above expression shows the total number of pens and pencils.
Example 2
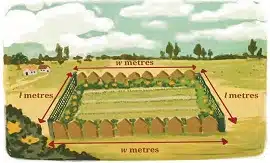
Suppose there is a rectangular garden where the length = l metres and width = w metres. The garden needs wire fencing along the length, wooden fencing along the width and special seeds for the whole garden.
Step 1: Cost of Wire Fencing
The wire fencing costs Rs. 100 per metre, and there are two lengths in a rectangle.
2l x 100 = 200l
So, the wire fencing cost is Rs. 200.
Step 2: Cost of Wooden Fencing
The wooden fencing costs Rs. 80 per metre, and there are two widths in a rectangle.
2w x 80 = 160w
So, the wooden fencing cost is Rs. 160w.
Step 3: Cost of Seeds
The seed cost is Rs. 50 per square metre, the area of the rectangle is l x w
So, seed cost will be
50 x l x w = 50lw
So, the seed cost is Rs. 50.
Step 4: Total Cost
The total cost will be –
200l + 160w + 50lw
Final Algebraic Expression
200l + 160w + 50lw
This expression represents the total cost of fencing and decorating the garden.
Example 3
A wire of length 20 cm is bent in different ways to form rectangles. For example, one rectangle has a length of 7 cm and a width of 3 cm, or another could have a length of 5.5 cm and a width of 4.5 cm. Can you write an expression for the area of such rectangles?
If the length of the rectangle is x cm, then the width is (10 – x) cm. The expression for the area of these rectangles is x(10 – x) or 10x – x².
Note that the algebraic expressions in Example 1 and Example 2 involve two variables, whereas the algebraic expression in Example 3 involves only one variable.
What is a polynomial?
A polynomial is an algebraic expression that has variables, numbers and powers of variables. For example,
x2 + 5x + 1
One-Variable Polynomials
Expressions like:
- 4x
- x2 + 1
- 2y − 5
- 5y3 + y2 + 2y − 1
- 3z + 7
The above expression contains only one variable (x, y or z), so this type of expression is called a one-variable polynomial.
Degree of a Polynomial
In the expression, the highest power of the variable is called the degree. For example, x2 + 5x + 1
The highest power of x is 2. So, the degree will be 2.
Some of the types of polynomials are the following –
- 5y3 + y2 + 2y – 1 is a polynomial of degree 3. Such polynomials are called cubic polynomials.
- x2 + 5x + 1 is a polynomial of degree 2. Such polynomials are called quadratic polynomials.
- 3z + 7 is a polynomial of degree 1. Such polynomials are called linear polynomials.
- The constant 8 is a polynomial of degree 0, as it can be written as 8x0 in which the power of the variable x is 0. Such polynomials are called constant polynomials.
Linear Polynomials
A linear polynomial is an algebraic expression in which the highest power of the variable is 1. For example,
ax + b
Here,
- ‘a’ and ‘b’ are numbers.
- ‘x’ is the variable.
- The highest power of x is 1.
Some of the linear polynomial examples are
- 4x
- 2x + 3
- 50m + 200
Example,
A chess club charges a joining fee of Rs 200 plus Rs 50 for every match played. The following table shows the amount a player will have to pay as the number of matches varies.
| Number of matches played | 1 | 2 | 3 | 4 | 5 | …… | m |
| Amount paid (Rs.) | 250 | 300 | 350 | 400 | 450 | ……. | 200 + 50m |
You will see on the above table the number of matches increases by 1 and the amount also increases by Rs. 50. This forms the linear pattern.
Let’s find the matches.
If a player paid ₹750:
- 200 + 50m = 750
- 50m = 550.
- m = 11
So, the player played 11 matches.
Linear Equation
When we equate a linear polynomial in one variable to a constant, we get a linear equation. For example, the sum of two numbers is 64. One of the numbers is 10 more than the other. What are the two numbers?
Let the smaller number be x.
Then the larger number is
- x + 10
Their sum is 64:
- x + (x + 10) = 64
Solve it:
- 2x + 10 = 64
- 2x = 54
- x = 27
Find both numbers.
- Smaller number: x = 27
- Larger number: x + 10 = 37
Answer:
The two numbers are 27 and 37.
Fig. shows this process as an input-output machine where the input is the value of x and the output is the value of 2x + 3. This process can be referred to as a function where the expression 2x + 3 is a function of the variable x.
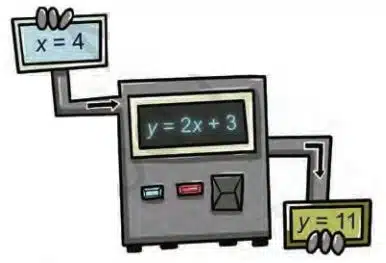
Note that 2x + 3 is a linear function, whereas 10x – x2 is a quadratic function.
Exploring linear patterns
Observe the following growing pattern of square tiles.
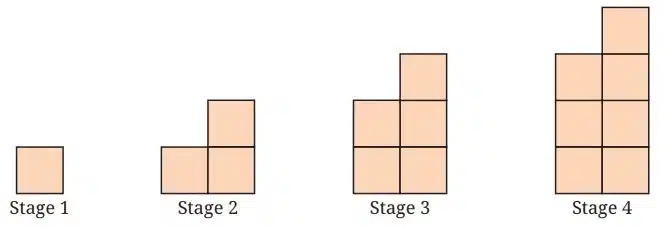
Each stage is obtained by adding two more tiles to the previous stage. The table mentions the number of tiles for the first seven stages.
| Stage | 1 | 2 | 3 | 4 | 5 | 6 | 7 |
| Number of the square tiles | 1 | 3 | 5 | 7 | 9 | 11 | 13 |
To generalise this pattern, we observe that the number of squares at each stage is one less than twice the number of the term.
Observation
Look at the pattern carefully:
- 1, 3, 5, 7, 9, 11, 13
Difference between consecutive terms:
- 3 − 1 = 2
- 5 − 3 = 2
- 7 − 5 = 2
The difference is always 2.
So, this is called a linear pattern.
Finding the Rule
We notice that:
- Stage 1: 2 × 1 − 1 = 1
- Stage 2: 2 × 2 − 1 = 3
- Stage 5: 2 × 5 − 1 = 9
So, for Stage n:
- 2n − 1
This formula gives the number of square tiles at any stage.
Why is it a linear polynomial?
The expression 2n − 1 has the highest power of n as 1. So, that’s why it is a linear polynomial.
If the degree is 1, it is a linear polynomial, and the relationship between stage number and tiles is called a linear relationship.
Example: Bela’s Pocket Money
Bela has Rs. 100 as pocket money; she wants to spend Rs. 5 every day. She wants to know how many days she will be left with Rs. 40.
| Day Number | 0 | 1 | 2 | 3 | 4 |
| Amount left (Rs.) | 100 | 100 – 1 × 5 = 95 | 100 – 2 × 5 = 90 | 100 – 3 × 5 = 85 | 100 – 4 × 5 = 80 |
Find the Number of Days
Every day, the money decreases by ₹5.
So, after n days, the amount left is:
- 100 − 5n
We are told that the amount left is Rs. 40.
So,
- 100 − 5n = 40
- −5n = −60
- n = 12
After 12 days, Bela will be left with Rs. 40.
Example: Auto-Rickshaw Fare
An auto-rickshaw charges Rs. 25 for the first 2 km, and after 2 km the fare increases by Rs. 15 per km. We need to find the fare for a journey of 10 km.
| Km travelled | 1 | 2 | 3 | 4 | 5 | 6 |
| Fare (Rs.) | 25 | 25 | 25 + 1 × 15 = 40 | 25 + 2 × 15 = 55 | 25 + 3 × 15 = 70 | 25 + 4 × 15 = 85 |
- The first 2 km fare is Rs. 25
- The total distance is 10 km
- The first two km already included, so the extra distance is 10 – 2 = 8 km
- Each extra km cost is Rs. 15. So, for 8 km: 8 x 15 = 120
- Add the total fare: 25 + 120 = 145
Final Answer
The fare for 10 km is Rs. 145.
Note that in all the above examples, the nth term is a linear expression in n. A linear pattern is a sequence of numbers where the difference between two consecutive terms is constant.
Linear growth and linear decay
Linear expressions help to model situations or phenomena where there is growth or decline. Consider the following examples:
Example Cost of a Journey
Suppose, the total cost of a journey is –
- C(d) = 100 + 60d
Here:
- C(d) = total cost in rupees
- d = distance travelled in km
Let us make a table of values for d varying from 0 to 10 km and show how the cost increases for every km.
| Distance travelled, d (km) | 0 | 1 | 2 | 3 | 4 | 5 |
| Cost, C (Rs.) | 100 | 160 | 220 | 280 | 340 | 400 |
In this example, as the value of d increases by one km, the value of the cost function C increases by a fixed amount of Rs. 60. This is an example of linear growth.
Example Linear Decay
The height of the water in a cylindrical tank is 3 m at the beginning of the summer. The height of water after t months is given by:
- h(t) = 3 − 0.5t
Here:
- h(t) = height of water in metres
- t = number of months
The formula says that the water height starts at 3 m and every month, the water level decreases by 0.5 m.
| Month, t | 0 | 1 | 2 | 3 | 4 |
| Height, h (m) | 3 | 2.5 | 2 | 1.5 | 1 |
In the example above, as the value of t increases by a fixed number (one month), the value of the height h decreases by a fixed number (0.5). Therefore, this example represents linear decay.
Linear growth describes a linear pattern where a quantity increases by a constant amount over equal intervals. Similarly, linear decay describes a linear pattern where a quantity decreases by a constant amount over equal intervals.
Linear Relationships
A linear relationship represents the relationship between two variables, x and y, and can be expressed as y = ax + b.
Example Mobile/Internet Bill
A telecom company charges a fixed monthly charge plus an extra charge based on data used: 10 GB Rs. 350 and 20 GB Rs. 550. We assume that y = ax + b
Equations
- For 10 GB: 350 = 10a + b
- For 20 GB: 550 = 20a + b
Final increase per GB
- 550 − 350 = (20a + b) − (10a + b)
- 200 = 10a
- a = 20
Meaning: Each 1 GB increases bill by Rs. 20
Find fixed charge (b)
Put a = 20 in the first equation.
- 350 = 10 × 20 + b
- 350 = 200 + b
- b = 150
Meaning: Even if no data is used, fixed bill is Rs. 150
Final Equation
y = 20x + 150
Thus, y = 20x + 150 represents the linear relationship between y, the bill amount in Rupees, and x, the number of GB of the internet data used.
A linear relationship always has the following:
- Constant increase or decrease
- Formula of form y = ax + b
- This forms a straight-line pattern
Visualising linear relationships
A linear pattern or relationship can be expressed in the form of an equation y = ax + b. Now we will learn to plot such an equation as a straight line.
- The Linear equation have a straight line
- The Linear equation need 2 points to draw the line
- Any point on the line must satisfy the equation
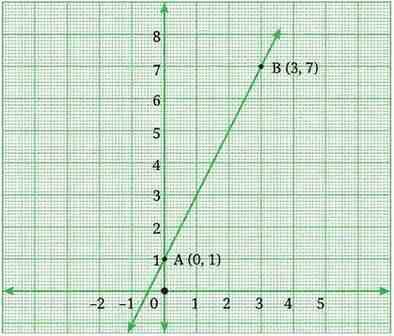
Example: y = 2x + 1
Step 1: Find points
- If x = 0, y = 1 → (0, 1) We can call this point A.
- If x = 3, y = 7 → (3, 7) We can call this point B.
What does “If x = 0, y = 1” mean?
We are just putting x = 0 into the equation:
- y = 2(0) + 1 = 1
So we get the point: (0, 1)
What about “If x = 3, y = 7”?
Again, we substitute x=3:
- y = 2(3) + 1 = 7
So we get the point: (3, 7)
Step 2: Plot points
Mark these points on graph paper.
- (0, 1)
- (3, 7)
Step 3: Join them
- Draw a straight line through both points
- Extend the line in both directions
Example 1: Let us plot the points (–1, –3), (0, 0), (1, 3), (3, 9), (4, 12) in the coordinate plane on a graph paper as shown. Join the points (–1, –3) and (4, 12) using a ruler. Can you guess the equation of this line by looking at the relationship between the x and y coordinates of each point?
Look at the pattern
(–1, –3), (0, 0), (1, 3), (3, 9), (4, 12)
| x | y |
|---|---|
| -1 | -3 |
| 0 | 0 |
| 1 | 3 |
| 3 | 9 |
| 4 | 12 |
y is always 3 times x
- -1 × 3 = -3
- 0 × 3 = 0
- 1 × 3 = 3
- 3 × 3 = 9
- 4 × 3 = 12
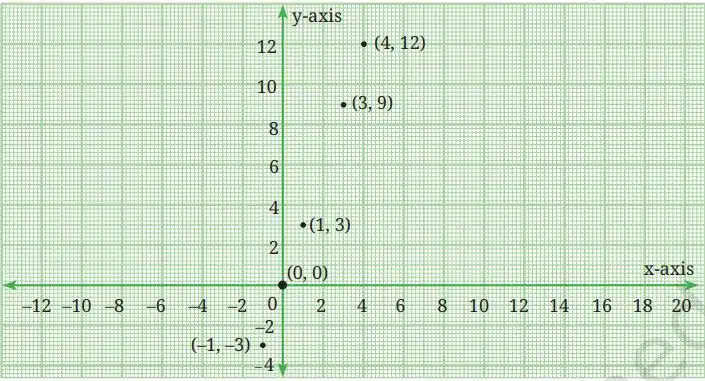
For each point, the value of the y-coordinate is three times that of the x-coordinate. We can therefore say that y = 3x.
Example 2: Let us plot the points (– 3, 6), (– 2, 4), (0, 0), (1, – 2), (2, – 4), (3, – 6) in the coordinate plane on a graph paper. Join the points (– 3, 6) and (3, – 6) using a ruler.
Look at the pattern
(– 3, 6), (– 2, 4), (0, 0), (1, – 2), (2, – 4), (3, – 6)
| x | y |
|---|---|
| -3 | 6 |
| -2 | 4 |
| 0 | 0 |
| 1 | -2 |
| 2 | -4 |
| 3 | -6 |
Every y is -2 times x
Check the relationship:
- -3 → 6 = -2 × (-3)
- -2 → 4 = -2 × (-2)
- 0 → 0 = -2 × 0
- 1 → -2 = -2 × 1
- 2 → -4 = -2 × 2
- 3 → -6 = -2 × 3
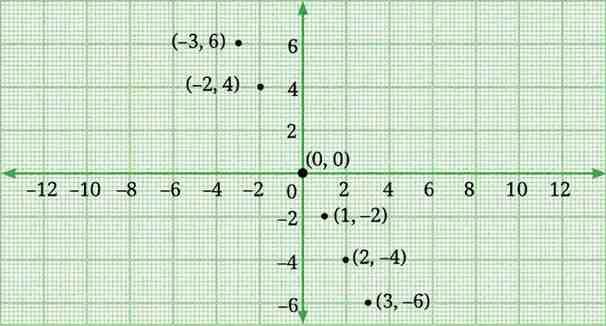
We can therefore say that y = -2x.
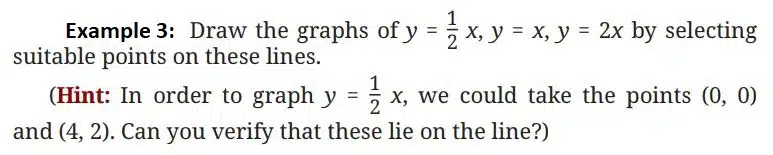
Linear Equation 1
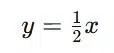
Take some value of x
| x | Half of x | y |
|---|---|---|
| 0 | Half of 0 | 0 |
| 2 | Half of 2 | 1 |
| 4 | Half of 4 | 2 |
| 6 | Half of 6 | 3 |
So the points are:
- (0,0)
- (2,1)
- (4,2)
- (6,3)
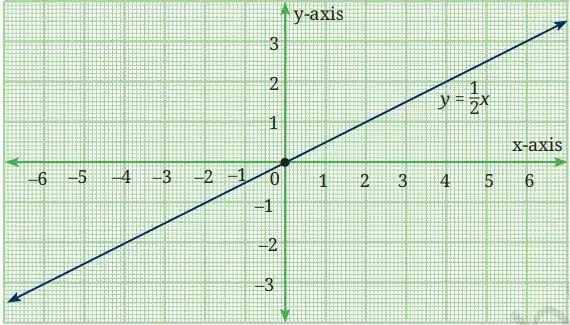
The relation between x and y is always fixed because the pattern never changes, so the graph becomes a straight line.
Linear Equation 2
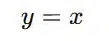
Take some values of x, x and y are always equal.
| x | y |
|---|---|
| 0 | 0 |
| 1 | 1 |
| 2 | 2 |
| 3 | 3 |
So the points are:
- (0,0)
- (1,1)
- (2,2)
- (3,3)
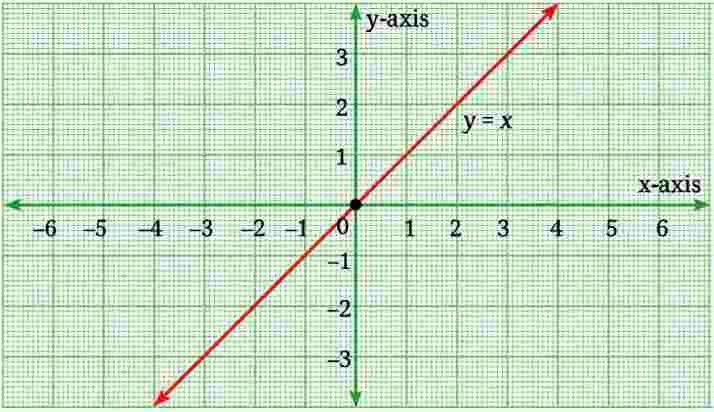
When you mark these points, then you will find all points fall in one direction and form a straight line.
Linear Equation 3
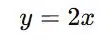
y is always 2 times x.
| x | y = 2x |
|---|---|
| 0 | 0 |
| 1 | 2 |
| 2 | 4 |
| 3 | 6 |
So the points are:
- (0,0)
- (1,2)
- (2,4)
- (3,6)
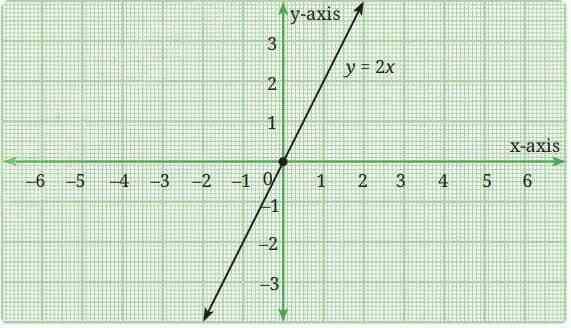
Whenever x increases by 1 and y increases by 2, then the increase is always constant and makes a straight line.
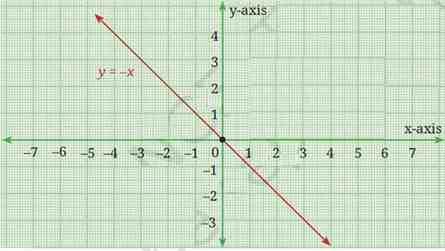
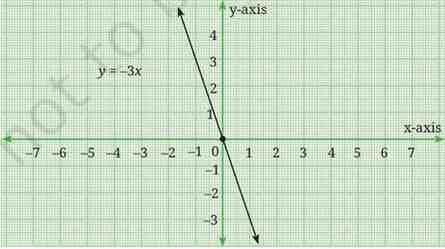
Fig. shows all the three graphs on the same axes. Does this help you to conclude anything about the linear equation y = ax, a > 0 as a varies? What happens when a > 1 and when a < 1?

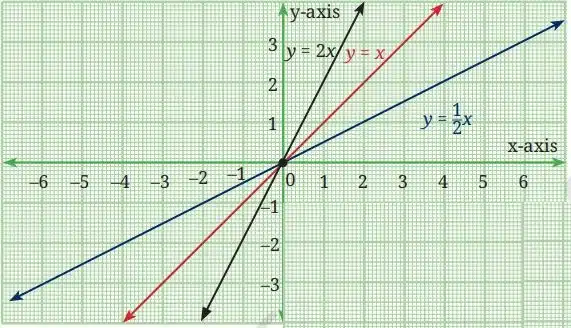
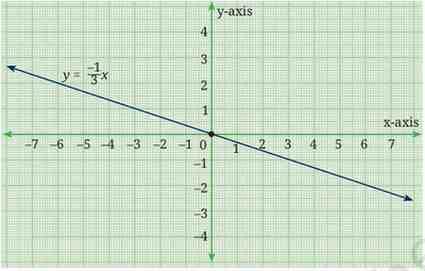
First of all, we observe that the straight lines representing an equation of the form y = ax, always pass through the origin (0, 0). Further, when a > 1, the line is steeper than the line y = x, which is equally inclined to both axes. However, when a < 1, the line is less steep than the line y = x. In fact, a is referred to as the slope of the line y = ax.

Example 6: Let us now draw the graphs of y = 2x – 1, y = 2x + 1, y = 2x + 5, first individually (as shown in Fig. 2.12) and then on the same axes.
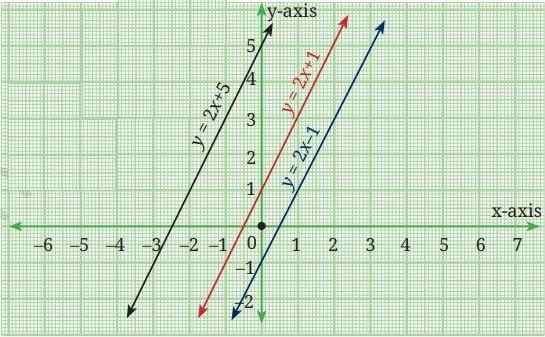
(Hint: In these equations a = 2, and b takes the values –1, 1 and 5, respectively.)
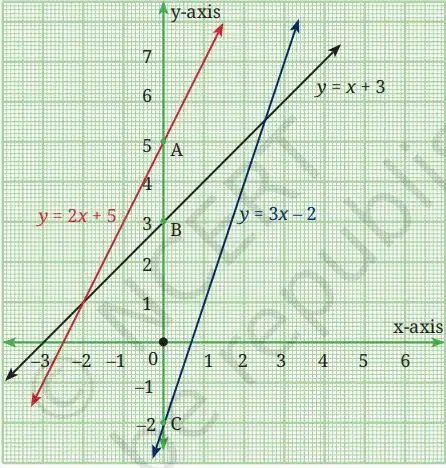
Now let us draw the graphs of the equations y = x + 3, y = 2x + 5 and y = 3x – 2. See Fig. 2.14 and observe where these lines cut the y-axis.
We see that,
- y = 2x + 5 cuts the y-axis at A (0, 5),
- y = x + 3 cuts the y-axis at B (0, 3), and
- y = 3x – 2 cuts the y-axis at C (0, –2).
We understand that the straight line written in the form y = ax + b cuts the y-axis at the point (0, b). The length of the b is referred to as the y-intercept of the line. Thus, the y-intercept of the line y = x + 3 is 3. This means that the line cuts the y-axis at a distance of the 3 units from the origin in the positive direction. Similarly, the y-intercept of the line y = 3x – 2 is -2. This means the line cuts the y-axis at a distance of 2 units from the origin in the negative direction.
We may conclude the following:
a = slope, b = y-intercept
- Changing a (keeping b same): slope changes, line becomes steeper or flatter
- Changing b (keeping a same): line shifts up or down
- Same a but different b: lines are parallel
Disclaimer: The content that is present on our website is based on the NCERT Class 9 Mathematics textbook and is provided for educational purposes only. All the content and images have been taken from Mathematics Class 9 NCERT Textbook and CBSE Support material. Images and content shown above are the property of individual organizations and are used here for reference purposes only.