In this chapter we are going to learn some of the statistical concepts, like what are subsets and what are mean, median and relative frequency? We will also see how these are used in the context of data science.
Use of Statistics in Data Science Class 10 Notes
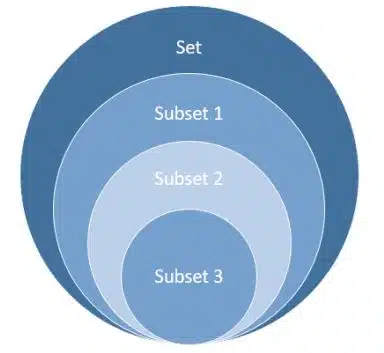
What are subsets?
A subset is a small portion of a large dataset; for example, artificial intelligence is a large dataset, but data science and machine learning are subsets of the large dataset. This helps to work in a certain area, instead of working with the entire dataset, which might be massive and unwieldy. Subet helps to:
- Improve efficiency and reduce load and speeds of analysis.
- Helps to focus on relevant data
- Helps for a specific question or hypothesis.
For example, if you have a table of 100 rows and 100 columns and you want to perform certain actions on the first 5 rows and the first 5 columns, you can separate it from the main table. This small table of 5 rows and 5 columns is known as a “subset” in data analytics.
How do we subset the data?
Subsetting means taking a small part from the big dataset. We use only those data which are required. This helps us to focus, save time and make analysis easier.
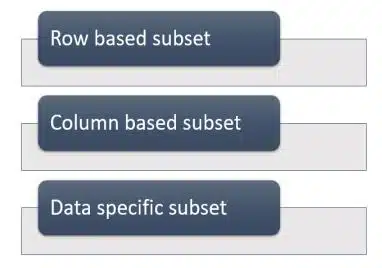
Type of subsetting
1. Row-Based Subsetting
Suppose one student table is there and you want to choose a specific row from the table; that is known as row-based subsetting. For example,
- You have a table with 6 rows and 4 columns.
- You only want the top 3 rows.
2. Column-Based Subsetting
In the table, if you want to choose specific columns, that is known as column-based subsetting. For example,
- Your table has columns like Name, Age, City and Marks.
- You only want Name and Marks.
3. Data-Based Subsetting
In the table, if you want to choose rows based on specific data or conditions, this is known as data-based subsetting. For example,
- You want only the rows where the city is “Pune”.
- Or maybeyou want rows where marks are more than 80.
Why do we use Subset?
It helps to focus only on useful data and make analysis faster and easier. It removes the unnecessary information from the table.
Two-way frequency table
A two-way frequency table is a chart that shows how two different categories of data are related to each other. It also helps us to count how many times each combination of categories appears.
- Rows show one category.
- Columns show another category.
- Cells show the number of people (frequency) that fit both categories.
Why use a two-way table?
- To compare two categories easily
- To find patterns in data
- To answer questions like “Who prefers what?” or “Which group is bigger?”
For example,
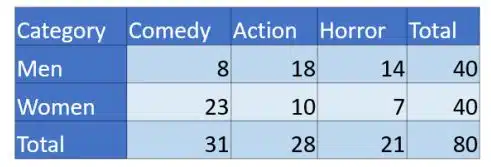
A survey of eighty people (40 men and 40 women) was taken on what genre of movie they would choose to watch, and the following responses were recorded:
- 8 men preferred comedy movies.
- 12 men preferred action movies.
- 14 men preferred horror movies.
- 16 women preferred comedy movies.
- 12 women preferred action movies.
- 6 women preferred horror movies.
The information collected is used to build the following two-way table:
Interpreting two-way tables
A two-way frequency table helps us to organise and count data that involves two categories. It shows how many times each combination of categories appears.
For example,
We have data of car ownership by gender.
Gender Owns a Car Doesn’t Own a Car Total
| Male | 30 | 10 | 40 |
| Female | 40 | 0 | 40 |
| Total | 70 | 10 | 18 |
Let’s see the interpretation of the data.
- 40 females own a car.
- Total people surveyed: 80
- People who don’t want to own a car 10
- Total males: 40
Here, you can easily compare the categories in the above table; we can also give the answers quickly using the counts. Whatever data is presented in the above table is organised and clear to understand, and this is an interpretation of the data.
Two-way relative frequency table
A two-way relative frequency table is similar to a two-way frequency table; the only difference is the two-way frequency table shows the counts, and the relative frequency table shows the percentages.
The two-way relative frequency table helps to compare data more easily, especially when the groups are there.
Meaning of mean
The mean is the average of a set of numbers. It tells us the central value of the number system. For example,
- Let’s say we have these numbers:10, 11, 12, 13, 14, 15, 16, 17, 18, 19, 20
- Total = 165
- Number of values = 11
- Mean = 165 ÷ 11 = 15
How to Calculate the Mean
- Step 1: Add all the numbers.
- Step 2: Divide the total by how many numbers there are.
Median
The median is the middle value in a sorted list of numbers. It is another way to find the central tendency of a dataset, just like a mean. For example,
Odd Number of Values
- Array: [12, 34, 56, 89, 32]
- Sorted: [12, 32, 34, 56, 89]
- Middle value (3rd position) = 34
- Median = 34
Even Number of Values
- Array: [10, 20, 30, 40]
- Sorted: [10, 20, 30, 40]
- Middle values = 20 and 30
- Median = (20 + 30) ÷ 2 = 25
Mean vs. median
So mean and median are both used to find the centre of a data set, but median is a more accurate form of central tendency, especially in scenarios where there are some irregular values, also known as outliers.
Why Use Median Instead of Mean?
Suppose any person’s blood pressure readings over 5 weeks are:
120, 122, 121, 119, 180 ← That last one is an error!
- Mean = (120 + 122 + 121 + 119 + 180) ÷ 5 = 132.4
- This is too high because of the error.
- Median = Middle value of sorted list: 119, 120, 121, 122, 180 → 121
- This is more accurate and reflects the usual readings.
Mean Absolute Deviation
Mean absolute deviation (MAD) tells us how different the numbers in a group are from the average. It shows how spread out the data is. For example,
Suppose 6 students got these marks in a test:
- 12, 16, 10, 18, 11, 19
Step 1: Find the Mean (Average)
- Add all the marks:
- 12 + 16 + 10 + 18 + 11 + 19 = 86
- Divide by 6 students:
- Mean = 86 ÷ 6 = 14
Step 2: Find the Difference from the Mean
- Now, check how far each mark is from 14. Ignore minus signs (take absolute value):
Mark Difference from Mean
| 12 | 2 |
| 16 | 2 |
| 10 | 4 |
| 18 | 4 |
| 11 | 3 |
| 19 | 2 |
Step 3: Find the Mean of These Differences
- Add the differences:
- 2 + 2 + 4 + 4 + 3 + 5 = 20
- Divide by 6:
- MAD = 20 ÷ 6 = 3.33
Now you will be able to understand that the average mark is 14 and not everyonegot exactly 14. On average each student’s mark is 3.33 points away from the 14. If the 14 is the centre of a circle, then the scores are scattered around it. MAD tells us how far they are from the centre.
Where Is MAD Used?
- In weather forecasting
- In Education
- In Business and Finance
- Used in the quality control department
What is Standard Deviation?
The standard deviation is the measure of how spread out the numbers are. To be specific, standard deviation represents how much the data is spread out around the mean or an average. For example, are all the points close to the average? Or are there lots of points way above or below the average?
In order to find standard deviation:
- Calculate the mean by adding up all the data pieces and dividing it by the number of pieces of the data.
- Subtract the mean from every value.
- Square each of the differences.
- Find the average of squared numbers calculated in point number 3 to find the variance.
- Lastly, find the square root of variance. That is the standard deviation.
A few real-life implementations of standard deviation include:
- Grading Tests – If a teacher wants to know whether students are performing at the same level or whether there is a higher standard deviation.
- To calculate the results of any survey – If someone wants to have some measure of reliability of the responses received in the survey, to predict how a bigger group of people may answer the same questions.
- Weather Forecasting – If a weather forecaster is analysing the low temperature forecasted for three different cities. A low standard deviation will always show a reliable weather forecast.
Disclaimer: We have taken an effort to provide you with the accurate handout of “Use of Statistics in Data Science Class 10 Notes“. If you feel that there is any error or mistake, please contact me at anuraganand2017@gmail.com. The above CBSE study material present on our websites is for education purpose, not our copyrights.
All the above content and Screenshot are taken from Data Science Class 10 Microsoft Textbook published on CBSE Website, CBSE Sample Paper, CBSE Old Sample Paper, CBSE Board Paper and CBSE Support Material which is present in CBSEACADEMIC website This Textbook and Support Material are legally copyright by Central Board of Secondary Education. We are only providing a medium and helping the students to improve the performances in the examination.
Images and content shown above are the property of individual organisations and are used here for reference purposes only. To make it easy to understand, some of the content and images are generated by AI and cross-checked by the teachers. For more information, refer to the official CBSE textbooks available at cbseacademic.nic.in.