Identifying Patterns Class 10 NCERT Solutions help students understand how to analyze data, find meaningful patterns, and apply logical reasoning in problem-solving.
Identifying Patterns Class 10 NCERT Solutions
Please choose the correct option in the questions below.
Q. What is the data science term used to describe partiality, preference, and prejudice?
a) Bias
b) Favouritism
c) Influence
d) Unfairness
Q. Which of the following is NOT a type of bias?
a) Selection Bias
b) Linearity Bias
c) Recall Bias
d) Trial Bias
Q. Which of the following is not a correct statement about a probability?
a) It must have a value between 0 and 1.
b) It can be reported as a decimal or a fraction.
c) A value near 0 means that the event is not likely to occur/happen.
d) It is the collection of several experiments.
Q. The central limit theorem states that the sampling distribution of the sample mean is approximately normal if
a) All possible samples are selected.
b) The sample size is large.
c) The standard error of the sampling distribution is small.
Q. The central limit theorem says that the mean of the sampling distribution of the sample mean is
a) Equal to the population mean divided by the square root of the sample size
b) Close to the population mean if the sample size is large
c) Exactly equal to the population mean
Q. A sample size of 25 is selected from a population with a mean of 40 and a standard deviation. 7.5. The mean of the sampling distribution sample mean is
a) 7.5
b) 8
c) 40
Standard Questions
Q. Explain what bias is and why it occurs in data science.
Answer: bias is a deviation from the expected outcome in the data. Fundamentally, you can also call bias an error in the data. Bias basically occurs because of sampling and estimation.
Q. Explain selection bias with the help of an example.
Answer: In Selection Bias occurs when the data used to train a model is not a good match for the real-world data. This means that the model learns from data, but the data does not match; in this condition, the model can generate bias. For example, if a website shows only certain videos and collected user feedback, then the model learns only from the visible data and misses out on the hidden part.
Q. Explain recall bias with the help of an example.
Answer: Recall bias is a type of measurement bias. It is common at the data labelling stage of any project. This type of bias occurs when you label similar types of data inconsistently. Thus, resulting in lower accuracy.
Q. Explain linearity bias with the help of an example.
Answer: Linearity bias assumes that change in one quantity produces an equal and proportional change in another. Unlike selection bias, linearity bias is a cognitive bias. This is produced not through some statistical process but rather through how mistakenly we perceive the world around us.
Q. Explain confirmation bias with the help of an example.
Answer: Confirmation bias, or observer bias, is an outcome of seeing what you want to see in the data. This can occur when researchers go into a project with some subjective thoughts about their study, which are either conscious or unconscious.
Q. What is the central limit theorem?
Answer: The Central Limit Theorem says that if you collect a sample from any group of people or things and calculate the average, then the result will look like a normal (bell-shaped) curve, even if the original group did not look like that.
Q. What is the formula for the central limit theorem?
Answer: The formula for the central limit theorem is:
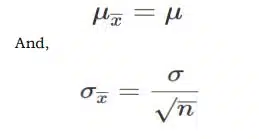
Where,
- μ = Population mean
- σ = Population standard deviation
- μx¯ = Sample mean
- σx¯ = Sample standard deviation
- n = Sample size
Q. What is the real-life application of the central limit theorem?
Answer:
- Voting Polls: News channels use CLT to guess how many people support a candidate. They take a small sample and make a prediction.
- Income Surveys: CLT helps to find the average family income in a region without asking every family.
Q. Why is the central limit theorem important?
Answer: The Central Limit Theorem helps us to make good guesses of the big group of people or things by studying a small random sample. The theorem says that if you take enough samples, then the average will form a normal (bell-shaped) curve, even if the original data is messy or uneven.
Q. The coaches of various sports around the world use probability to better their game and create gaming strategies. Can you explain how probability is applied in this case and how it helps players?
Answer: It helps coaches and players make smarter decisions based on data. The coaches who use probability in sports strategy are:
- Game planning and tactics
- Predicting opponent behaviour
- Optimising play calls
- Player positioning
- Heat maps & shot charts
- Fielding strategy in cricket
- Injury Prevention
- Load Management
- Substitution Timing
- Performance Forecasting
- Win probability models
- Player matchups
- Talent Scouting and Recruitment
- Predictive Analytics
It helps players
- To make better decision-making
- Confidence Building
- Skill Development
Disclaimer: We have taken an effort to provide you with the accurate handout of “Identifying Patterns Class 10 NCERT Solutions“. If you feel that there is any error or mistake, please contact me at anuraganand2017@gmail.com. The above CBSE study material present on our websites is for education purpose, not our copyrights.
All the above content and Screenshot are taken from Data Science Class 10 Microsoft Textbook published on CBSE Website, CBSE Sample Paper, CBSE Old Sample Paper, CBSE Board Paper and CBSE Support Material which is present in CBSEACADEMIC website This Textbook and Support Material are legally copyright by Central Board of Secondary Education. We are only providing a medium and helping the students to improve the performances in the examination.
Images and content shown above are the property of individual organisations and are used here for reference purposes only. To make it easy to understand, some of the content and images are generated by AI and cross-checked by the teachers. For more information, refer to the official CBSE textbooks available at cbseacademic.nic.in.