Teachers and Examiners (CBSESkillEduction) collaborated to create the Clustering Notes. All the important Information are taken from the NCERT Textbook Artificial Intelligence (417).
Clustering Notes
What is Clustering?
Finding a pattern in a set of unlabeled data is the goal of clustering, which is an unsupervised learning technique. Clustering is a strategy for grouping comparable data in a way that makes the data and objects in a group more similar to one another than the data and objects in the other groups.
Imagine that you have a sizable library of books that you must categorise and arrange in a bookcase.
You don’t know anything about the contents of the books because you haven’t read them all. You begin by first gathering the books with related titles and this is clustering.
Let us understand this with a simple graphical example:

Clustering algorithms can be applied in many fields, for instance:
Marketing – It’s critical to target the appropriate demographic if you’re a business. Clustering algorithms can identify people who are likely to buy your goods or service and group them together. To enhance the likelihood of a sale, focus your messaging on the groups you’ve identified.
Biology – Classification of plants and animals given their features.
Libraries – Book ordering
Insurance – Identifying groups of motor insurance policy holders with a high average claim cost; Identifying frauds
City-planning – Identifying groups of houses according to their house type, value and geographical location
Earthquake studies – Clustering observed earthquake epicenters to identify dangerous zones
WWW – Document classification; clustering weblog data to discover groups of similar access patterns
Identifying Fake News – Fake news is being created and spread at a rapid rate due to technology innovations such as social media. But clustering algorithm is being used to identify fake news based on the news content.
Clustering Notes
Clustering Workflow
In order to cluster the data, the following steps are required to be taken:
Prepare the data – The set of features that will be made available to the clustering method is referred to as data preparation. The data representation must include descriptive features in the input set (feature selection) for the clustering approach to be effective, or else new features based on the original set will be generated (feature extraction). We normalise, scale, and alter feature data at this stage.
Create similarity metrics – You must aggregate all of the feature data from the two examples into a single numeric value in order to determine how similar two data sets are. Consider a set of shoe data where the only attribute is “shoe size.” By calculating the size difference between two pairs of shoes, you may determine how comparable they are. The similarity between shoes increases as the numerical gap between sizes decreases. A manual similarity measure is one that was manually created. Any clustering technique relies on the similarity measure, so it must be carefully selected.
Run the clustering algorithm – When using machine learning, you occasionally come across datasets with millions of samples. To handle these massive datasets, ML algorithms must scale effectively. However, because they must determine the similarity between each pair of points, many clustering techniques are not scalable. The process of clustering data can be done in a variety of ways. For a more thorough taxonomy of clustering approaches, the cluster algorithms can be roughly divided into hierarchical or dividing categories.
Interpret the results – Since clustering is unsupervised, there is no “truth” to validate findings. The absence of truth makes evaluating quality more difficult. The interpretation of the findings in this case is essential.
Clustering Notes
Types of Clustering
In fact, there are more than 100 clustering algorithms known. But few of the algorithms are used popularly, let’s look at them in detail:
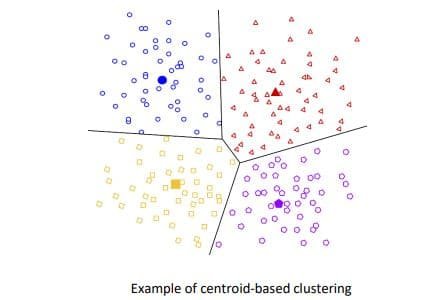
Centroid-based clustering – The most popular centroid-based clustering algorithm is k-means, which groups the data into non-hierarchical clusters. Although efficient, centroid-based algorithms are sensitive to beginning conditions and outliers. K-means is the primary clustering algorithm covered in this course because it is straightforward, effective, and efficient.
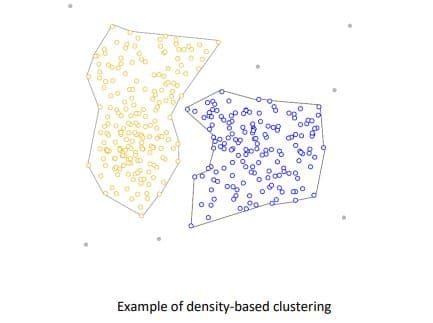
Density-based clustering – High example density locations are linked together into clusters using density-based clustering. This permits distributions of any shape, provided that dense regions can be connected. These algorithms struggle with data that has several dimensions and different densities. Additionally, these techniques do not allocate outliers to clusters by design.
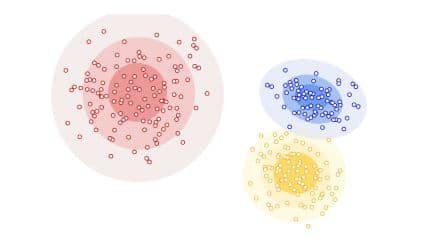
Distribution-based Clustering – Distribution-based The clustering approach presupposes that the data is made up of distributions, such Gaussian distributions. The distribution-based algorithm groups the data into three Gaussian distributions, as shown in the picture below. The likelihood that a point belongs to the distribution reduces as one moves away from the distribution’s centre. These waning probabilities are depicted by the bands. Use a different approach if you don’t know what kind of distribution your data have.
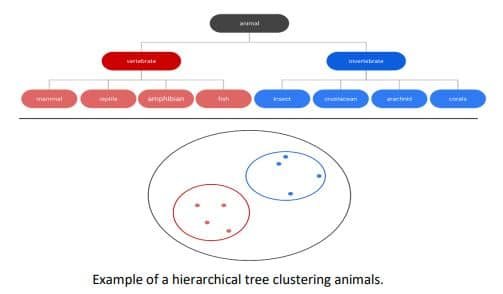
Hierarchical clustering – A tree of clusters is produced through hierarchical clustering. Unsurprisingly, hierarchical data, like taxonomies, are ideally suited to hierarchical clustering. For an illustration, see Oksana Lukjancenko, Trudy Wassenaar, and Dave Ussery’s Comparison of 61 Sequenced Escherichia coli Genomes. Another benefit of pruning the tree at the proper level is that any number of clusters can be selected.
Clustering Notes
K- means Clustering
Iterative clustering algorithm K-means seeks to locate local maxima with each iteration. This algorithm has two steps to it –
Step 1: Cluster Assignment
The algorithm visits each data point in this stage and places the data point on one of the cluster centroids. The distance a data point has to travel to a specific centroid to be assigned to a given cluster.
Step 2: Move centroid
K-means relocates the centroids to the average of the points in a cluster in the move centroid step. In other words, the algorithm finds the centroid’s location by calculating the average of all the points in a cluster and moving the centroid there. The process is continued until all data points are grouped together and there is no longer any room for the clusters to shift. The initial cluster’s number is determined at random.
Applying the K-Means Algorithm
Iteration 1 – To begin, we construct two centroids using random numbers, and then we place each data point in the cluster of the nearest centroid. We want to generate two clusters in this instance since we are utilising two centroids, which corresponds to K=2.
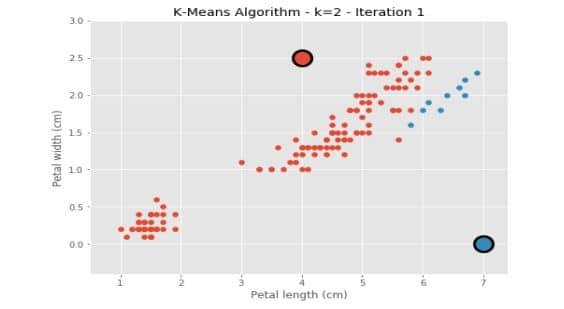
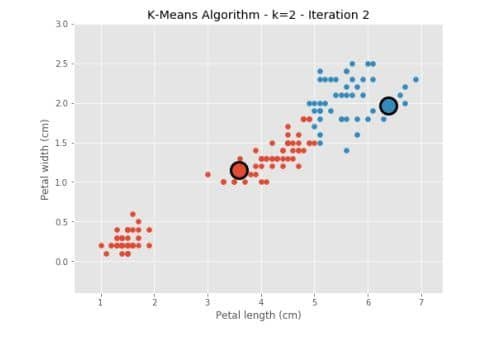
Iteration 2 – The centroids are not distributed equally, as you can see above. In the following iteration,
Using an algorithm, the new centroid values are determined as the average values of the two clusters.
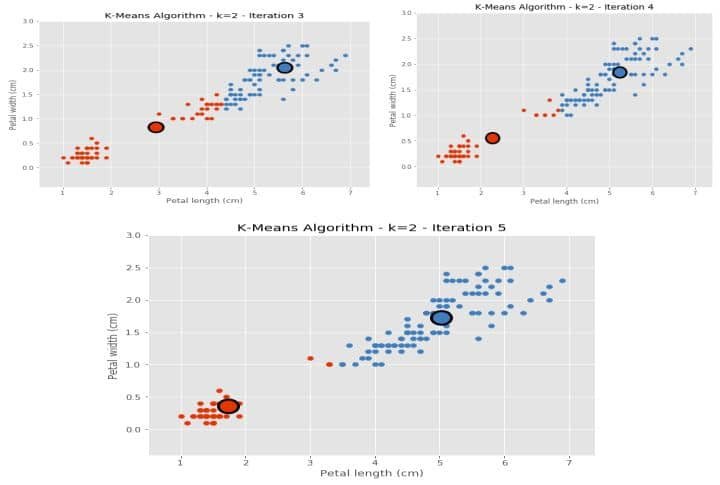
Iterations 3-5 – We repeat the process until there is no further change in the value of the centroids.
k-Means Clustering: Advantages and Disadvantages
Advantages of k-means
- Relatively simple to implement.
- Scales to large data sets.
- Guarantees convergence.
- Can warm-start the positions of centroids.
- Easily adapts to new examples.
- Generalizes to clusters of different shapes and sizes, such as elliptical clusters.
Disadvantages of k-means
- Choosing k manually
- Being dependent on initial values – For a low k, you can reduce this reliance by running k-means multiple times with various initial values and selecting the best outcome. As “k” rises, more sophisticated k-means algorithms are required (referred to as “k-means seeding”) to select better initial centroids.
- Data clustering with changing cluster sizes and densities – K-means struggles to cluster data with varying cluster sizes and densities. You must generalise k-means as outlined in the Advantages section in order to cluster such data.
- Clustering outliers – Outliers in a cluster can drag centroids or they may form their own cluster in place of being ignored. Before clustering, take into account eliminating or clipping outliers.
- Scaling with the number of dimensions – A distance-based similarity measure between any two samples converges to a fixed value as the number of dimensions rises. Feature data can be subjected to PCA to reduce dimensionality, or the clustering technique can be modified using “spectral clustering,” as will be discussed below.
k-means Generalization
The k-means approach, which divides clusters with various means, is generalised by the k-groups procedure. We suggest two k-groups algorithms: the first version of k-groups and the second variation of k-groups. K-group implementation is based in part on Hartigan and Wong’s k-means technique.
Two graphs side-by-side. The first showing a dataset with somewhat obvious clusters. The second showing an
odd grouping of examples after running k-means.
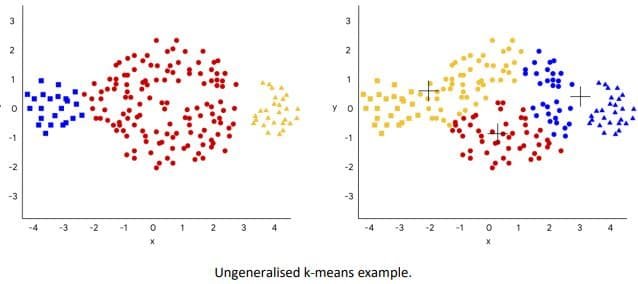
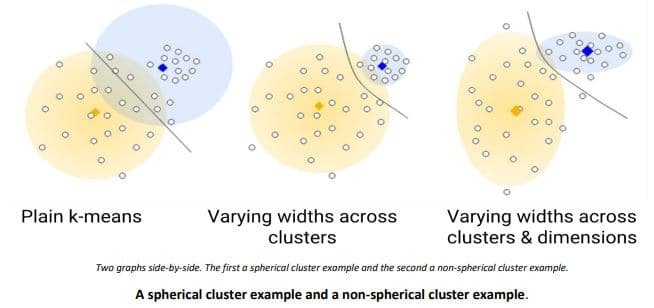
To cluster naturally imbalanced clusters like the ones shown in Figure 1, you can adapt (generalize) k-means.
In Figure, the lines show the cluster boundaries after generalizing k-means as:
a. Left plot – No generalization, resulting in a non-intuitive cluster boundary.
b. Centre plot – Allow different cluster widths, resulting in more intuitive clusters of different sizes.
c. Right plot – Besides different cluster widths, allow different widths per dimension, resulting in elliptical instead of spherical clusters, improving the result.
Why is it Unsupervised?
We cluster data points by dividing them into various clusters. As a result, clustering typically groups the data based on the similarity of the features rather than the target or labels. As a result, clustering uses a similarity function to assess how similar two data points are (k indicates that Euclidean distance is assessed). And because the feature you give the cluster determines the kind of groups you get, feature engineering is important in clustering.
How do you classify it?
1. The usual approach requires a set of labelled data/or a person to annotate the clusters.
4. Decide the features
5. Cluster the data
6. Use labelled data or human evaluators to annotate the clusters
Employability Skills Class 11 Notes
- Unit 1 : Communication Skills – III
- Unit 2 : Self-Management Skills – III
- Unit 3 : Information and Communication Technology Skills – III
- Unit 4 : Entrepreneurial Skills – III
- Unit 5 : Green Skills – III
Employability Skills Class 11 MCQ
- Unit 1 : Communication Skills – III
- Unit 2 : Self-Management Skills – III
- Unit 3 : Information and Communication Technology Skills – III
- Unit 4 : Entrepreneurial Skills – III
- Unit 5 : Green Skills – III
Employability Skills Class 11 Questions and Answers
- Unit 1 : Communication Skills – III
- Unit 2 : Self-Management Skills – III
- Unit 3 : Information and Communication Technology Skills – III
- Unit 4 : Entrepreneurial Skills – III
- Unit 5 : Green Skills – III
Subject Specific Skills Notes
- Unit 1: Introduction To AI
- Unit 2: AI Applications & Methodologie
- Unit 3: Maths For AI
- Unit 4: AI Values (Ethical Decision Making)
- Unit 5: Introduction To Storytelling
- Unit 6: Critical & Creative Thinking
- Unit 7: Data Analysis (Computational Thinking)
- Unit 8: Regression
- Unit 9: Classification & Clustering
- Unit 10: AI Values (Bias Awareness)
