Ratio Analysis is one of the most important topics in Class 10 Introduction to Financial Accounting. It helps students understand the relationship between two or more accounting figures and analyze the financial position of a business.
Ratio Analysis Class 10 Notes
Why Just Numbers Aren’t Enough in Financial Statements
Financial statements like the balance sheet, profit & loss account and cash flow statement have a lot of numbers, but these numbers don’t tell the full story of the company. To understand the company profile, like whether the company makes a profit or loss, whether the company uses its assets wisely or not, and whether the company is healthy or surviving, you need to analyse the data. To extract the information from the financial statements, a number of tools are used to analyse such statements. The most popular tool is the ratio analysis.
Financial ratios can be broadly classified into three groups:
- liquidity ratios
- leverage/capital structure ratios
- profitability ratios.
1. Liquidity ratios
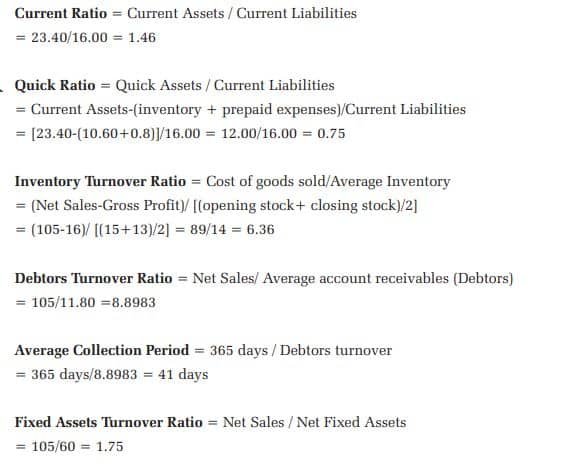
Liquidity means how much a company has the ability to pay its short-term bills within one year. These ratios help to understand how the company has the ability to turn its assets into cash. Certain ratios, which indicate the liquidity of a firm, are (i) (i) (i) (i) (i) (i) (i) Current Ratio, (ii) Acid Test Ratio, and (iii) Turnover Ratios.
(i) Current Ratio
The current ratio tells us how well a company can pay its short-term bills using its short-term assets. The higher the current ratio, the greater the short-term solvency (i.e., the larger the amount of rupees available per rupee of liability).
(ii) Acid-test Ratio
The acid-test ratio is a measurement of a firm’s ability to convert its current assets quickly into cash in order to meet its current liabilities. Generally speaking, a 1:1 ratio is considered to be satisfactory.
(iii) Turnover Ratios
Turnover ratios measure how quickly certain current assets are converted into cash or how efficiently the assets are employed by a firm. The important turnover ratios are:
- Inventory Turnover Ratio: The inventory turnover ratio tells how many times the company sold and replaced its stock during the year. A higher ratio means better inventory management.
- Debtors Turnover Ratio: It shows how many times the company has collected money from customers throughout the year. A higher ratio means better credit control.
- Average Collection Period: It tells how many days it takes to collect money from debtors. Lower days = faster collection
- Fixed Assets Turnover: Shows how efficiently the company uses its fixed assets to generate sales. Higher ratio = better asset use
- Total Assets Turnover: It shows how efficiently the company uses all its assets to generate revenue. Higher ratio = more efficient company
2. Leverage/Capital Structure Ratios:
Long-term financial strength or soundness of a firm is measured in terms of its ability to pay interest regularly or repay principal on due dates or at the time of maturity. Such long-term solvency of a firm can be judged by using leverage or capital structure ratios. Two Types of Leverage Ratios
(i) Balance Sheet-Based Ratios
These compare borrowed money with owners’ capital or assets.
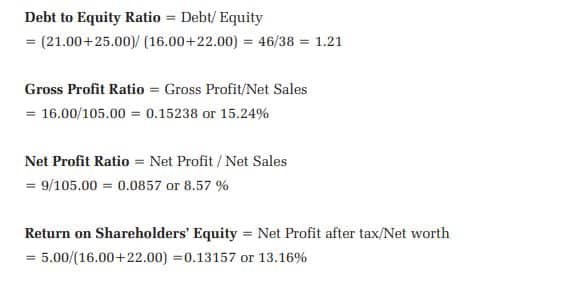
- Debt-Equity Ratio: It shows how much debt the company has compared to owners’ funds. A higher ratio means more risk; a lower ratio means a safer company.
- Debt-Asset Ratio: It shows how much of the company assets are financed by debt. A higher ratio means more borrowed money used.
(ii) Profit & Loss-Based Ratios
These show how well the company can pay interest and repay loans from its profits.
- Interest Coverage Ratio: Shows how easily the company can pay interest. A higher ratio means a better ability to pay interest.
- Debt Service Coverage Ratio (DSCR): It shows how well the company can pay both interest and loan principal. Higher DSCR = safer for lenders
3. Profitability Ratios
Profitability and operating/management efficiency of a firm are judged mainly by the following profitability ratios:

Some of the profitability ratios related to investments are:

There are several other measures to calculate return on hareholders’ equity of which the following are the stock market related ratios:
Earnings Per Share (EPS): EPS measures the profit available to the equity shareholders per share, that is, the amount that they can get on every share held.

Price-Earnings Ratios


Disclaimer: We have taken an effort to provide you with the accurate handout of “Ratio Analysis Class 10 Notes“. If you feel that there is any error or mistake, please contact me at anuraganand2017@gmail.com. The above CBSE study material present on our websites is for education purpose, not our copyrights.
All the above content and Screenshot are taken from Introduction to Financial Markets Class 10 NCERT Textbook, CBSE Sample Paper, CBSE Old Sample Paper, CBSE Board Paper and CBSE Support Material which is present in CBSEACADEMIC website, NCERT websiteThis Textbook and Support Material are legally copyright by Central Board of Secondary Education. We are only providing a medium and helping the students to improve the performances in the examination.
Images and content shown above are the property of individual organizations and are used here for reference purposes only. For more information, refer to the official CBSE textbooks available at cbseacademic.nic.in
