Data Merging is an essential concept in Data Science Class 10 (CBSE Subject Code 419). It refers to combining two or more datasets into a single dataset for better analysis and understanding. By learning data merging, students understand how information from different sources can be integrated to create meaningful insights.
Data Merging Class 10 Notes
Overview of Data Merging
Data merging means combining two or more sets of data into one. This is helpful when you store data in different files or tables and you want to analyze everything together.
Challenges in Data Merging
The following problems are the challenges when you are merging the data.
- Different files may have different names for the same thing.
- Data may be grouped in different ways.
- Some data may be old or created for other purposes.
We can perform data merging by implementing data joins on the databases in frame. There are three categories of data joins:
- One-to-One Joins
- One-to-Many Joins
- Many-to-Many Joins
1. One-to-One Joins
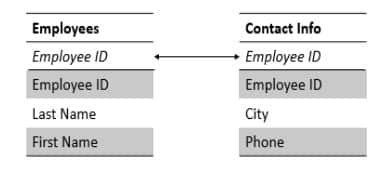
One-to-one join is probably one of the simplest join techniques. In this type of join, each row in one table is linked to a single row in another table using a “key” column.
In the database, a one-to-one relationship looks like this:

To join this, we use a primary key to connect two tables in the database. The employee ID is the primary key in the employee table, and in another table, the same employee ID is also the primary key. When you join these tables, you match rows where the employee ID is the same.
2. One-to-Many Joins
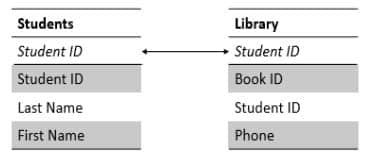
A one-to-many join means that one item in one table is connected to many items in another table.
In the database, a one-to-many relationship looks like this:

In the above table the student ID is a primary key in the students table, and in the library table, student ID is defined as a foreign key. Now when we join these tables, then we match all books to the student who borrowed them.
3. Many-to-Many Joins
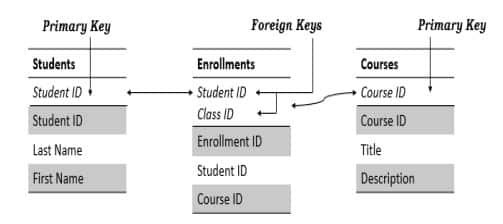
A many-to-many join happens when many items in one table are connected to many items in another table.
The below table demonstrates the Student table, which contains a record for every student. It also contains a Courses table, which contains a record for each course. A join table called Enrollments creates two one-to-many relationships, one between each of the two tables.

What is a Z-score?
A Z-score tells us how far a number is from the average (mean) using standard deviation as the unit.
- If the Z-score is positive, then the number is above the average.
- If the Z-score is negative, then the number is below the average.
Why Is It Useful?
- It helps to compare different values.
- Understand if a value is normal or unusual.
- Work with standard normal distribution.
How to calculate a Z-score?
The mathematical formula for calculating the z-score is as follows:
Z = (x-μ) / σ
Where,
- X = raw score
- μ = Population mean
- σ = Population Standard Deviation
For example,
Q. If the average weight of kids is 10 kg and the standard deviation is 2 kg, then what is the Z-score for 12 kg?
Z = (12 – 10) / 2
Z = 1
Answer: Z – 1 -> 12 kg is 1 standard deviation above the average.
How to interpret the Z-score?
The value of a z-score always tells us how many standard deviations we are away from the mean. For example, if the z-score is equal to 0, it is on the mean.
- A positive z-score tells us that the raw score is higher than the mean average. For example, if the z-score is equal to +2, It is 2 standard deviations above the mean.
- A negative z-score tells us that the score is below the mean average. For example, if a z-score is equal to -3, it is 3 standard deviations below the mean.
Why is a Z-score so important?
It is very helpful to standardize the values of a normal distribution by converting them into z-scores because:
- It gives us an opportunity to calculate the probability of a value occurring within a normal distribution.
- Z-score allows us to compare two values that are from the different samples.
Concept of Percentiles
A percentile shows how a value compares to the rest of the data. It tells us what percentage of values are equal to or below a certain number.
- The 100th percentile is the highest value in the data.
- The pth percentile means p% of the values are at or below that number.
Easy Example,
Suppose we have data of:
[10, 12, 15, 17, 13, 22, 16, 23, 20, 24]Step 1: Sort the data.
Sorted: [10, 12, 13, 15, 16, 17, 20, 22, 23, 24]
Step 2: Find how many values are at or below 22.
There are 8 values at or below 22.
Step 3: Total number of values = 10
So, (8 ÷ 10) × 100 = 80%.
Result: 22 is the 80th percentile.
Quartiles
Quartiles divide a set of data into four equal parts. Each part has 25% of the data.
- Q1 (First Quartile) = 25th percentile -> 25% of data is below this point.
- Q2 (Second Quartile) = 50th percentile -> This is the median (middle value).
- Q3 (Third Quartile) = 75th percentile -> 75% of data is below this point.
- Q4 (Fourth Quartile) = 100th percentile -> This is the maximum value.
Example:
Data: [10, 20, 30, 40, 50, 60, 70, 80, 90, 100]
- Q2 (Median) = (50 + 60) / 2 = 55
- Q1 = Median of [10, 20, 30, 40, 50] → 30
- Q3 = Median of [60, 70, 80, 90, 100] → 80
Interquartile Range (IQR)
IQR shows the spread of the middle 50% of the data:
IQR = Q3 − Q1 = 80 − 30 = 50
This type of method is used in weather reports, instead of using the full range. We use IQR to show a more accurate and stable temperature range.
Deciles
Deciles divide a set of data into 10 equal parts. Each part represents 10% of the data.
- D1 = 10th percentile
- D2 = 20th percentile
- …
- D9 = 90th percentile
- D10 = 100th percentile (maximum value)
Higher decile = higher rank. For example, scoring in the 9th decile means you’re better than 90% of others.
How to Calculate a Decile
Use this formula:
D𝑖 = i x (n + 1) / 10
Where:
- i = decile number (1 to 9)
- n = total number of values
- Find the position, then use interpolation if needed.
Disclaimer: We have taken an effort to provide you with the accurate handout of “Data Merging Class 10 Notes“. If you feel that there is any error or mistake, please contact me at anuraganand2017@gmail.com. The above CBSE study material present on our websites is for education purpose, not our copyrights.
All the above content and Screenshot are taken from Data Science Class 10 Microsoft Textbook published on CBSE Website, CBSE Sample Paper, CBSE Old Sample Paper, CBSE Board Paper and CBSE Support Material which is present in CBSEACADEMIC website This Textbook and Support Material are legally copyright by Central Board of Secondary Education. We are only providing a medium and helping the students to improve the performances in the examination.
Images and content shown above are the property of individual organisations and are used here for reference purposes only. To make it easy to understand, some of the content and images are generated by AI and cross-checked by the teachers. For more information, refer to the official CBSE textbooks available at cbseacademic.nic.in.
