Teachers and Examiners (CBSESkillEduction) collaborated to create the Regression Class 11 Notes. All the important Information are taken from the NCERT Textbook Artificial Intelligence (417).
Regression Class 11 Notes
Regression is a technique or algorithm used in machine learning to model a target value using separate predictors. It simply functions as a statistical tool for determining the correlation between two variables, one of which is reliant on the other. This approach is useful for forecasting and determining the causal connection between variables.
Regression techniques differ based on:
1. The number of independent variables
2. The type of relationship between the independent and dependent variable
Correlation is a measure of the strength of a linear relationship between two quantitative variables
a. Correlation is positive when the values increase together
b. Correlation is negative when one value decreases as the other increases

Correlation can have a value:
a. 1 is a perfect positive correlation
b. 0 is no correlation (the values don’t seem linked at all)
c. -1 is a perfect negative correlation
Regression Class 11 Notes
Crosstabs and Scatterplots
Crosstabs
We can build a link between two variables with the aid of cross tabs. A table showing this relationship is used.
The crosstab below displays whether a person has an unlisted phone number by age.

a. This table displays the number of observations for each possible combination of the two variables’ values in each table cell.
b. For example, we can see that 185 people between the ages of 18 and 34 do not have an unlisted phone number.
c. Additionally, percentages within the columns are displayed, with each column’s percentages adding up to 100%. For instance, 24% of all those without an unlisted phone number are between the ages of 18 and 34.
d. People without unlisted numbers have a distinct age distribution than those with unlisted numbers. In other words, a correlation between the two is shown by the crosstab: younger persons are more likely to have unlisted phone numbers.
e. As a result, it is also possible to conclude that the variables used to make this table are connected. We would state that these two categorical variables were not correlated if there was no connection between them.
Scatterplots
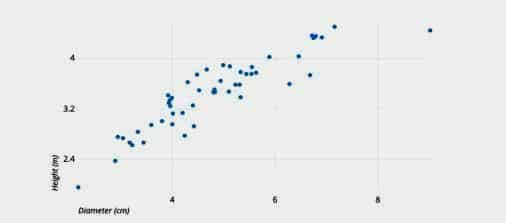
The values for two different numerical variables are represented by dots in a scatter plot (also known as a scatter chart or scatter graph). Each dot’s location on the horizontal and vertical axes represents a data point’s values. To view relationships between variables, utilise scatter plots.

Regression Class 11 Notes
Pearson’s r
The Pearson correlation coefficient, where r = 1 denotes a perfect positive correlation and r = -1 denotes a perfect negative correlation, is used to assess the strength of a linear link between two variables. Therefore, you may use this test to determine whether there is a correlation between people’s height and weight (the taller a person is, the more likely it is that they will be heavier).
The following conditions must be met for Pearson’s correlation coefficient: The scale should be either interval or ratio.
a. Variables should be approximately normally distributed
b. The association should be linear
c. There should be no outliers in the data
Equation

What does this test do?
The ‘r’ symbol stands for the Pearson product-moment correlation coefficient, also known as the Pearson correlation coefficient, which is a measure of the strength of a linear link between two variables. The Pearson correlation coefficient, r, shows how distant all of these data points are from this line of greatest fit (i.e., how well the data points match this new model/line of best fit). Basically, a Pearson product-moment correlation seeks to draw a line of best fit through the data of two variables.
What values can the Pearson correlation coefficient take?
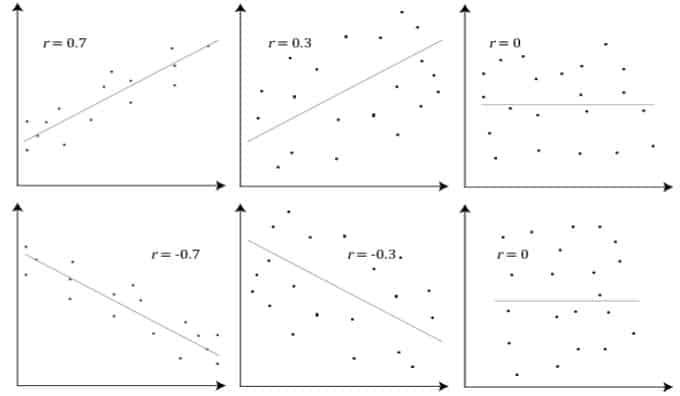
Between +1 and -1 are the possible values for the Pearson correlation coefficient, or r. There is no link between the two variables, as indicated by a value of 0. Positive associations have values greater than 0, meaning that if one variable’s value rises, so does the value of the other. A result that is less than 0 denotes a negative connection, meaning that when one variable’s value rises, the value of the other variable falls. The illustration below demonstrates this:

Regression Class 11 Notes
How can we determine the strength of association based on the Pearson correlation coefficient?
The Pearson correlation coefficient, r, will be closer to +1 or -1, depending on whether the link is positive or negative, respectively, the stronger the association between the two variables.
A score of +1 or -1 indicates that all of your data points are on the line of best fit; no data points deviate from this line in any manner. Variation around the line of best fit is indicated by r values between +1 and -1, such as 0.8 or -0.4. The variation around the line of best fit increases as the value of r approaches zero. The graphic below displays many relationships and their correlation coefficients –

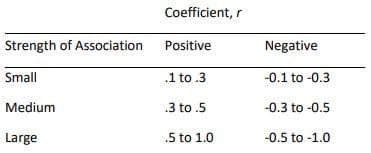
Are there guidelines to interpreting the Pearson’s correlation coefficient?
Yes, the following guidelines have been proposed:

Regression Class 11 Notes
Assumptions
A Pearson’s correlation is supported by four “assumptions”. The results of your data analysis utilising a Pearson’s correlation may not be accurate if any one of these four conditions is not satisfied.
Assumption # 1 – It is best to measure the two variables continuously. These continuous variables include, for instance, height (measured in feet and inches), temperature (measured in °C), salary (measured in dollars/INR), revision time (measured in hours), IQ score (intelligence), reaction time (measured in milliseconds), test performance (measured from 0 to 100), sales (measured in number of transactions per month), and so on.
Assumption # 2 – Your two variables must be linearly related to one another. While there are several techniques to determine whether a Pearson’s correlation exists, we advise using Stata to create a scatterplot so that you can compare your two variables. The scatterplot can then be visually inspected to ensure linearity. Your scatterplot might resemble one of the examples below:

Assumption #3 – There shouldn’t be any notable exceptions. Outliers are merely individual data points in your data that deviate from the pattern that is typically observed (for instance, in a study of 100 students’ IQ scores, where the mean score was 108 with only a small variation between students, one student had a score of 156, which is extremely unusual and may even place her in the top 1% of IQ scores globally). The possible impact of outliers is highlighted in the scatterplots below:

Assumption # 4 – The distribution of your variables should be roughly normal. Bivariate normality is required to evaluate the statistical significance of the Pearson correlation, but because this assumption is challenging to evaluate, a more straightforward approach is more frequently used.
Regression Class 11 Notes
Regression – Finding The line
Regression analysis refers to the process of creating a distribution in which more than one variable is involved. The value of the variable that depends on the other is typically found, or rather predicted.
Let x and y be two different variables. If y relies on x, the outcome takes the form of a straightforward regression. We also give the variables x and y the following names:
y – Regression or Dependent Variable or Explained Variable
x – Independent Variable or Predictor or Explanator
Employability Skills Class 11 Notes
- Unit 1 : Communication Skills – III
- Unit 2 : Self-Management Skills – III
- Unit 3 : Information and Communication Technology Skills – III
- Unit 4 : Entrepreneurial Skills – III
- Unit 5 : Green Skills – III
Employability Skills Class 11 MCQ
- Unit 1 : Communication Skills – III
- Unit 2 : Self-Management Skills – III
- Unit 3 : Information and Communication Technology Skills – III
- Unit 4 : Entrepreneurial Skills – III
- Unit 5 : Green Skills – III
Employability Skills Class 11 Questions and Answers
- Unit 1 : Communication Skills – III
- Unit 2 : Self-Management Skills – III
- Unit 3 : Information and Communication Technology Skills – III
- Unit 4 : Entrepreneurial Skills – III
- Unit 5 : Green Skills – III
Subject Specific Skills Notes
- Unit 1: Introduction To AI
- Unit 2: AI Applications & Methodologie
- Unit 3: Maths For AI
- Unit 4: AI Values (Ethical Decision Making)
- Unit 5: Introduction To Storytelling
- Unit 6: Critical & Creative Thinking
- Unit 7: Data Analysis (Computational Thinking)
- Unit 8: Regression
- Unit 9: Classification & Clustering
- Unit 10: AI Values (Bias Awareness)
