Teachers and Examiners (CBSESkillEduction) collaborated to create the Capstone Project Class 12. All the important Information are taken from the NCERT Textbook Artificial Intelligence (417).
Capstone Project Class 12
Capstone Project
What is Capstone Project?
In general, capstone projects are made to encourage students to think critically, work through difficult problems, and develop skills like oral communication, public speaking, research techniques, media literacy, group collaboration, planning, self-sufficiency, or goal setting—i.e., abilities that will help them get ready for college, contemporary careers, and adult life.
Understanding The Problem
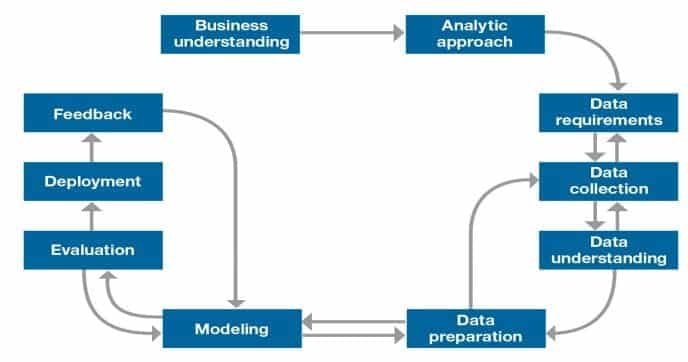
The most revolutionary technology now in use is probably artificial intelligence. Every AI project goes through the following six processes at a high level –
1) Problem definition i.e. Understanding the problem
2) Data gathering
3) Feature definition
4) AI model construction
5) Evaluation & refinements
6) Deployment
Decomposing The Problem Through DT Framework
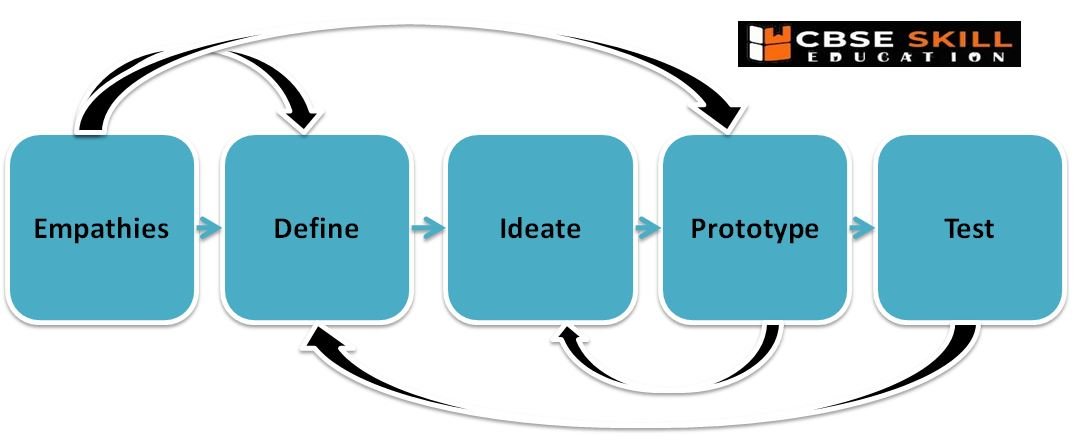
A design methodology called “Design Thinking” offers a problem-based approach to problem solving. It is really helpful in solving intricate situations that are unclear or unidentified.
The five stages of Design Thinking are as follows: Empathize, Define, Ideate, Prototype, and Test.

The complexity of real computational problems is high. Prior starting coding, you must divide the task into smaller components in order to achieve them.
Problem decomposition steps
1. Understand the problem and then restate the problem in your own words
- Know what the desired inputs and outputs are
- Ask questions for clarification (in class these questions might be to your instructor, but most of the time they will be asking either yourself or your collaborators)
2. Break the problem down into a few large pieces. Write these down, either on paper or as comments in a file.
3. Break complicated pieces down into smaller pieces. Keep doing this until all of the pieces are small.
4. Code one small piece at a time.
- Think about how to implement it
- Write the code/query
- Test it… on its own.
- Fix problems, if any
Decompose Time Series Data into Trend
Decomposing a series into its level, trend, seasonality, and noise components is known as time series decomposition. A helpful abstract paradigm for thinking about time series generally and for better comprehending issues that arise during time series analysis and forecasting is decomposition.
These components are defined as follows –
- Level: The average value in the series.
- Trend: The increasing or decreasing value in the series.
- Seasonality: The repeating short-term cycle in the series.
- Noise: The random variation in the series.
Analytic Approach
Using an appropriate process to separate an issue into the components needed to solve it is known as an analytical approach. Each component shrinks in size and gets simpler to deal with.
Every day, those who work in the fields of AI and machine learning use data to solve issues and provide answers. They create models to forecast results or identify underlying trends in order to gather insights that will help them take decisions that will enhance future outcomes.

Data Requirement
The data scientist must determine the following if the issue at hand is “a recipe,” so to speak, and data is “an ingredient:
1. which ingredients are required?
2. how to source or the collect them?
3. how to understand or work with them?
4. and how to prepare the data to meet the desired outcome?
It is crucial to establish the data requirements for decision-tree classification before beginning the data collecting and data preparation stages of the process. For the initial data gathering, this entails determining the necessary data content, formats, and sources.
Modeling Approach
Data Modeling focuses on developing models that are either descriptive or predictive.
a. An example of a descriptive model might examine things like: if a person did this, then they’re likely to prefer that.
b. A predictive model tries to yield yes/no, or stop/go type outcomes. These models are based on the analytic approach that was taken, either statistically driven or machine learning driven.
For predictive modelling, the data scientist will use a training set. An previous data set with established results is referred to as a “training set.” The training set serves as a gauge to ascertain whether the model requires calibration. The data scientist will experiment with several algorithms at this step to make sure the variables are genuinely needed.
Understanding the issue at hand and using the right analytical strategy are essential for the effectiveness of data collection, preparation, and modelling. Similar to how the quality of the ingredients in a meal influences the final product, the data bolsters the question’s answer.
Constant refinement, adjustments and tweaking are necessary within each step to ensure the outcome is one that is solid. The framework is geared to do 3 things:
a. First, understand the question at hand.
b. Second, select an analytic approach or method to solve the problem.
c. Third, obtain, understand, prepare, and model the data.
How to validate model quality
Train-Test Split Evaluation
The train-test split is a technique for evaluating the performance of a machine learning algorithm.
It can be used for classification or regression problems and can be used for any supervised learning algorithm.
The procedure involves taking a dataset and dividing it into two subsets. The first subset is used to fit the model and is referred to as the training dataset.
The second subset is not used to train the model; instead, the input element of the dataset is provided to the model, then predictions are made and compared to the expected values. This second dataset is referred to as the test dataset.
- Train Dataset: Used to fit the machine learning model.
- Test Dataset: Used to evaluate the fit machine learning model.
How to Configure the Train-Test Split
The size of the train and test sets serves as the procedure’s key configurable parameter. For either the train or test datasets, this is most frequently given as a percentage that ranges from 0 to 1. For example, if the size of the training set is 0.67 (67 percent), the test set will receive the leftover percentage of 0.33 (33 percent).
There is no optimal split percentage.
You must choose a split percentage that meets your project’s objectives with considerations that include:
- Computational cost in training the model.
- Computational cost in evaluating the model.
- Training set representativeness.
- Test set representativeness.
Nevertheless, common split percentages include:
- Train: 80%, Test: 20%
- Train: 67%, Test: 33%
- Train: 50%, Test: 50%
Splitting
Let’s split this data into labels and features. Now, what’s that? Using features, we predict labels. I mean using features (the data we use to predict labels), we predict labels (the data we want to predict).
1. >>> y=data.temp
2. >>> x=data.drop(‘temp’,axis=1)
Temp is a label to predict temperatures in y; we use the drop() function to take all other data in x. Then, we split the data.
1. >>> x_train,x_test,y_train,y_test=train_test_split(x,y,test_size=0.2)
2. >>> x_train.head()
Train-Test Split for Regression
A method for assessing a machine learning algorithm’s performance is the train-test split. It can be applied to issues involving classification or regression as well as any supervised learning algorithm. The process entails splitting the dataset into two subsets.
On the housing dataset, we will show you how to evaluate a random forest method using the train-test split.
The housing dataset, which has 506 rows of data and 13 numerical input variables and a numerical target variable, is a typical machine learning dataset.
The dataset entails estimating the price of a home given the location of the home in the Boston suburbs of the United States.
Metrics of model quality by simple Math and examples
You need to assess the accuracy of your forecasts after you’ve made them. We can use standardised metrics to gauge how accurate a set of forecasts is in reality.
You may assess how good a particular machine learning model of your problem is by knowing how good a set of predictions is. You must estimate the quality of a set of predictions when training a machine learning model.
You may get a clear, unbiased understanding of the quality of a set of predictions and, consequently, the quality of the model that produced them, using performance metrics like classification accuracy and root mean squared error.
This is important as it allows you to tell the difference and select among:
a. Different transforms of the data used to train the same machine learning model.
b. Different machine learning models trained on the same data.
c. Different configurations for a machine learning model trained on the same data.
RMSE (Root Mean Squared Error)
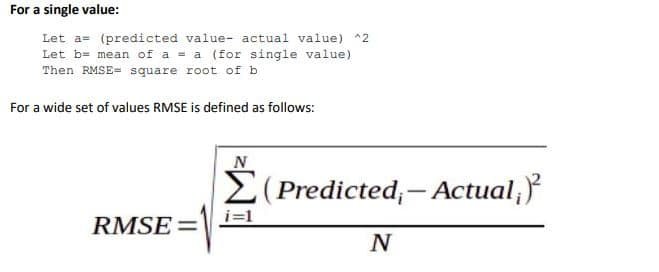
The RMS method RMS values may have been utilised in statistics as well. In machine learning, we consider the root mean square of the error that has occurred between the test values and the predicted values in order to evaluate the correctness of our model:

MSE (Mean Squared Error)
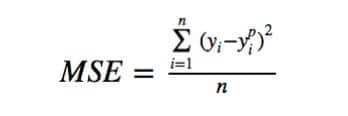
The most used regression loss function is Mean Square Error (MSE). MSE is the sum of the squared deviations between the values of our target variable and the predictions.

Below is a plot of an MSE function where the true target value is 100, and the predicted values range
between -10,000 to 10,000. The MSE loss (Y-axis) reaches its minimum value at prediction (X-axis) = 100.
The range is 0 to ∞.
Why use mean squared error
MSE is sensitive to outliers, and the best prediction will be their mean target value. The best forecast is the median when comparing this to Mean Absolute Error. Therefore, MSE is a smart choice if you think your goal data, given the input, is normally distributed around a mean value and you want to punish outliers harshly.
When to use mean squared error
Use MSE when performing regression if you want large errors to be significantly (quadratically) more punished than small ones and if your target, conditional on the input, is normally distributed.
Employability Skills Class 12 Notes
- Unit 1 : Communication Skills – IV
- Unit 2 : Self-Management Skills – IV
- Unit 3 : Information and Communication Technology Skills – IV
- Unit 4 : Entrepreneurial Skills – IV
- Unit 5 : Green Skills – IV
Employability Skills Class 12 MCQ
- Unit 1 : Communication Skills – IV
- Unit 2 : Self-Management Skills – IV
- Unit 3 : Information and Communication Technology Skills – IV
- Unit 4 : Entrepreneurial Skills – IV
- Unit 5 : Green Skills – IV
Employability Skills Class 12 Questions and Answers
- Unit 1 : Communication Skills – IV
- Unit 2 : Self-Management Skills – IV
- Unit 3 : Information and Communication Technology Skills – IV
- Unit 4 : Entrepreneurial Skills – IV
- Unit 5 : Green Skills – IV
Artificial Intelligence Class 12 Notes
- Unit 1: Capstone Project
- Unit 2: Model Lifecycle
- Unit 3: Storytelling Through Data
